Unlock a world of possibilities! Login now and discover the exclusive benefits awaiting you.
- Qlik Community
- :
- All Forums
- :
- QlikView App Dev
- :
- How to set colour in bar chart
- Subscribe to RSS Feed
- Mark Topic as New
- Mark Topic as Read
- Float this Topic for Current User
- Bookmark
- Subscribe
- Mute
- Printer Friendly Page
- Mark as New
- Bookmark
- Subscribe
- Mute
- Subscribe to RSS Feed
- Permalink
- Report Inappropriate Content
How to set colour in bar chart
Hi guys, checked old answers first.
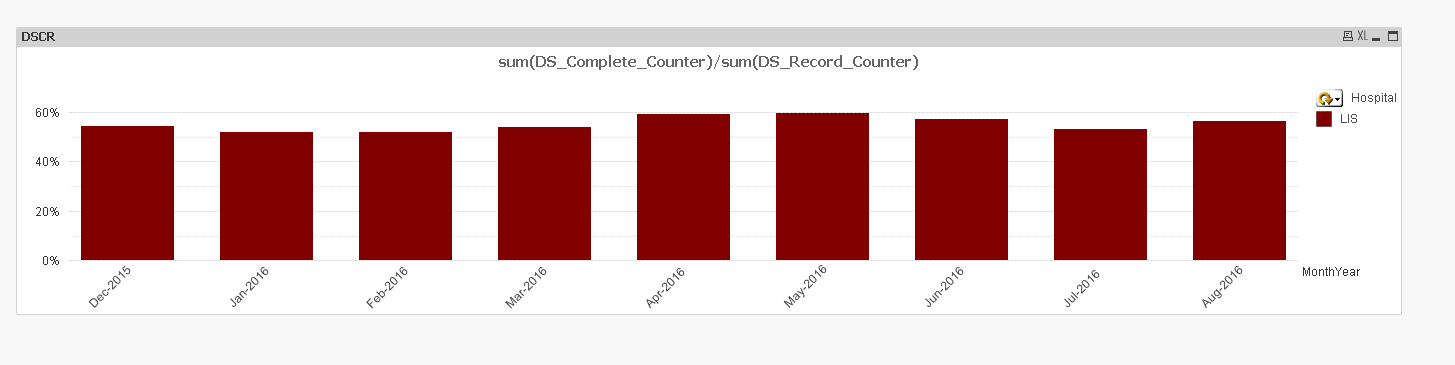
I have a bar chart with 2 dims. I am summing 2 counters across the dims.
I have a dimension - MonthYear. I also have a cyclical group.
I am summing two counters across each M-Y to display a percentage result.
When the result is below 0.95, I want the bar to be red, regardless of the cyclical chosen.
In chart properties, I've tried adding the below to the Dimension (MonthYear) background colour. I've used 0.59 as I can see some results above and below 0.59, so can visually confirm.
=IF(((sum(DS_Complete_Counter)/sum(DS_Record_Counter))<0.59),Red(), Green())
In the the cyclical dim, I've added the same test.
In Colours, I also changed the first colour to be calculated, using the same formula.
I cannot for the life of me to get this to work.
Thanks for any help!
Accepted Solutions
- Mark as New
- Bookmark
- Subscribe
- Mute
- Subscribe to RSS Feed
- Permalink
- Report Inappropriate Content
Disregard! The ONLY place I hadn't checked was the background colour accessible from + drop down in Expression editor.
Found it as I'd kept my QV training scripts which I knew addressed it.
Cheers!