Unlock a world of possibilities! Login now and discover the exclusive benefits awaiting you.
- Qlik Community
- :
- All Forums
- :
- QlikView App Dev
- :
- Re: How to set sub-totals in graphs or tables?
- Subscribe to RSS Feed
- Mark Topic as New
- Mark Topic as Read
- Float this Topic for Current User
- Bookmark
- Subscribe
- Mute
- Printer Friendly Page
- Mark as New
- Bookmark
- Subscribe
- Mute
- Subscribe to RSS Feed
- Permalink
- Report Inappropriate Content
How to set sub-totals in graphs or tables?
Hi,
I have created a dashboard based on the sum of records by month and by category.
The dashboard is showing me just one total for all the sum, but I will like to have it by Month, for example:
Month Category Total
57
01 Sales 15
01 Support 8
01 Changes 4
02 Sales 4
02 Support 4
02 Changes 5
03 Sales 7
03 Support 2
03 Changes 8
...
Is possible to have something like:
01 Sales 15
01 Support 8
01 Changes 4
Total 27
02 Sales 4
02 Support 4
02 Changes 5
Total 13
03 Sales 7
03 Support 2
03 Changes 8
Total 17
I look forward.
Accepted Solutions
- Mark as New
- Bookmark
- Subscribe
- Mute
- Subscribe to RSS Feed
- Permalink
- Report Inappropriate Content
I created an expression as the following:
SUM({$<Month={">04"}>}[Total]) / SUM({$<Month={">04"}, [Category]=>} TOTAL <Month> [Total])
Then in the Number's tab select fixed to and checked the show in percent value.
Now it's displaying what I want. Thank you all for your help.
- Mark as New
- Bookmark
- Subscribe
- Mute
- Subscribe to RSS Feed
- Permalink
- Report Inappropriate Content
Hi,
Yes you can get the sub totals in Pivot Table.
Go to Presentation tab and Sub total for your dimension.
- Mark as New
- Bookmark
- Subscribe
- Mute
- Subscribe to RSS Feed
- Permalink
- Report Inappropriate Content
You need to enable the Show Partial Sum Check box.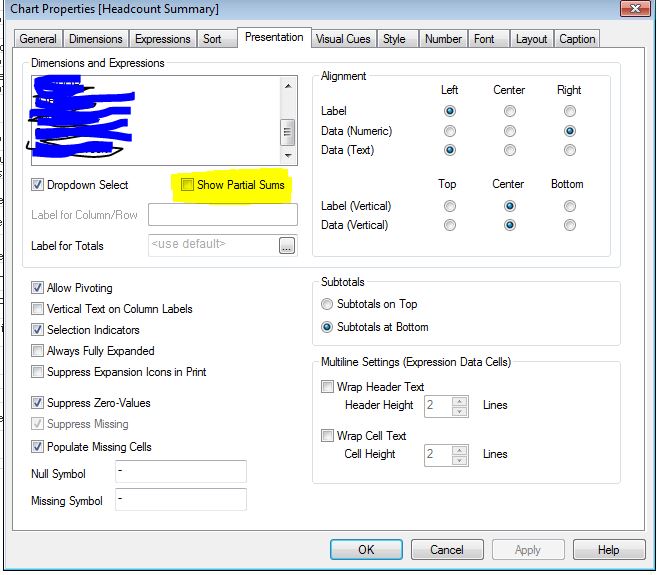
- Mark as New
- Bookmark
- Subscribe
- Mute
- Subscribe to RSS Feed
- Permalink
- Report Inappropriate Content
Your answer worked just the half. I have the total displayed as relative, but if I change the type of table I won't have the relative checkbox.
Same happens with my bar's dashboard that has the relative but not the sub totals in the presentation tab.
Any idea?
- Mark as New
- Bookmark
- Subscribe
- Mute
- Subscribe to RSS Feed
- Permalink
- Report Inappropriate Content
Hi,
You need to convert your expression for relative like your (expression)/100
- Mark as New
- Bookmark
- Subscribe
- Mute
- Subscribe to RSS Feed
- Permalink
- Report Inappropriate Content
OK, how can I do the same for bar's graph?
- Mark as New
- Bookmark
- Subscribe
- Mute
- Subscribe to RSS Feed
- Permalink
- Report Inappropriate Content
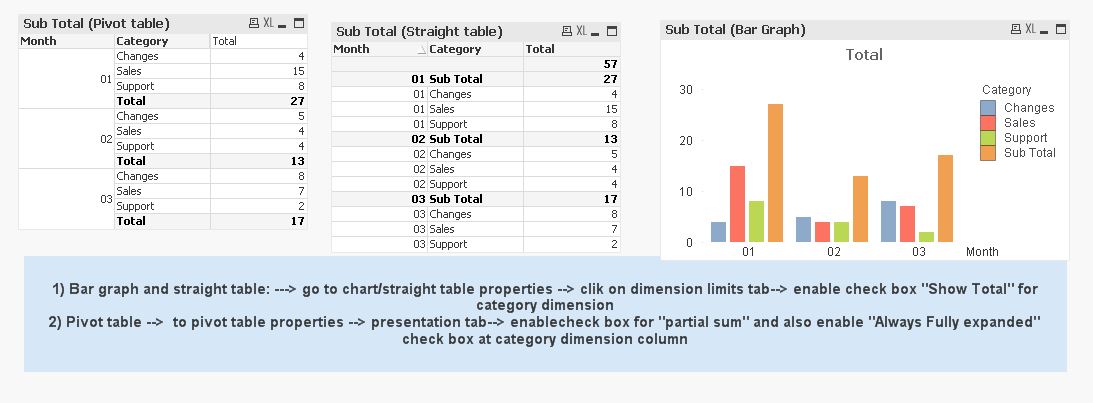
In a Straight Table you can show subtotals by checking "Show Total" on the Dimension Limits tab.
-Rob
- Mark as New
- Bookmark
- Subscribe
- Mute
- Subscribe to RSS Feed
- Permalink
- Report Inappropriate Content
Hi,
Bar Graph also can be done. just enable check box for "Show total" at ---> properties --> Dimension limit
- Mark as New
- Bookmark
- Subscribe
- Mute
- Subscribe to RSS Feed
- Permalink
- Report Inappropriate Content
I created an expression as the following:
SUM({$<Month={">04"}>}[Total]) / SUM({$<Month={">04"}, [Category]=>} TOTAL <Month> [Total])
Then in the Number's tab select fixed to and checked the show in percent value.
Now it's displaying what I want. Thank you all for your help.