Unlock a world of possibilities! Login now and discover the exclusive benefits awaiting you.
- Qlik Community
- :
- All Forums
- :
- QlikView App Dev
- :
- Re: How to show both number and percentage value o...
- Subscribe to RSS Feed
- Mark Topic as New
- Mark Topic as Read
- Float this Topic for Current User
- Bookmark
- Subscribe
- Mute
- Printer Friendly Page
- Mark as New
- Bookmark
- Subscribe
- Mute
- Subscribe to RSS Feed
- Permalink
- Report Inappropriate Content
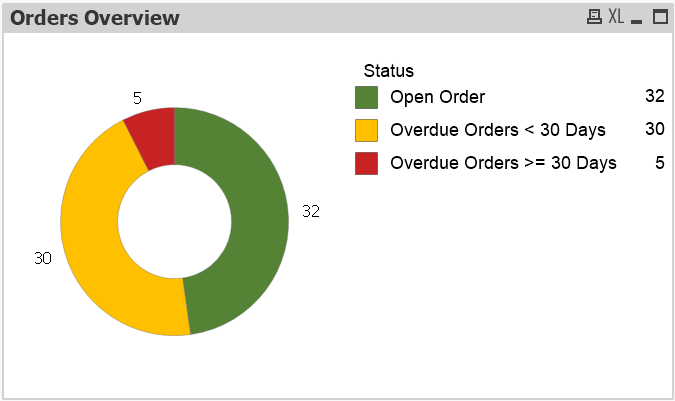
How to show both number and percentage value on a Pie chart in QlikView
Hi Guys,
I'm trying to display values on data points on a pie chart in both number and relative percentage but i'm only able to achieve one of them. So, either i'm able to show the values in number or in percentage but my task is show it in both simultaneously, I thought of using text object with the expression in it but that won't work as the placement of the object will be static and when data changes or if user do some selections then it won't make any sense.
Is there anyway to achieve this in QlikView?
Any help or suggestions will be hugely appreciated.Sample chart attached below
- Mark as New
- Bookmark
- Subscribe
- Mute
- Subscribe to RSS Feed
- Permalink
- Report Inappropriate Content
You can add one more expression in pie chart and make it text as pop up and show that expression as relative.
- Mark as New
- Bookmark
- Subscribe
- Mute
- Subscribe to RSS Feed
- Permalink
- Report Inappropriate Content
You can use two expressions one for % and another for absolute value.
- Mark as New
- Bookmark
- Subscribe
- Mute
- Subscribe to RSS Feed
- Permalink
- Report Inappropriate Content
Hey,
Still fairly new to Qlikview myself, but I think this is what you're looking for:
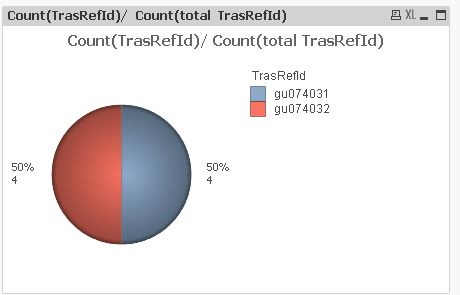
1. Create another expression with the same definition as the one you used to calculate your values
2. Check 'Relative' for the second expression, under the 'comment' input field
3. Check 'Values on data points' for both expressions
4. Adjust presentation/number format as you wish (I think default for relative expressions is percentage fixed to 2 decimals)
Hope this helps, and again I'm fairly new to Qlikview so there might be a better solution.
- Mark as New
- Bookmark
- Subscribe
- Mute
- Subscribe to RSS Feed
- Permalink
- Report Inappropriate Content
Thanks Vijeta, it worked nicely. Just one more thing that I wanted to discuss is, can we make the size of Pie/Donut chart static. Currently it keeps on changing depending on the user selection.
- Mark as New
- Bookmark
- Subscribe
- Mute
- Subscribe to RSS Feed
- Permalink
- Report Inappropriate Content
Thanks for the solution Jens. Even I'm very new this tool.I have done exactly what you have mentioned and it works nicely. Just facing another problem though. Size of the Donut just keeps on changing based on the user selection.
Again thanks for your answer.
- Mark as New
- Bookmark
- Subscribe
- Mute
- Subscribe to RSS Feed
- Permalink
- Report Inappropriate Content
Thanks Tresesco, this works.
- Mark as New
- Bookmark
- Subscribe
- Mute
- Subscribe to RSS Feed
- Permalink
- Report Inappropriate Content
I had a look around but I couldn't really find a solution as simple as checking a 'static size' box or anything unfortunately...
Since the chart seems to get smaller to make space for the labels, one option would be to simply make the chart big or small enough to fit all the labels regardless of selection (So either big enough to the point where the largest labels don't reduce the size of the chart or big enough so any label reduces the size of the chart and it's permanently small).
Keep in mind that you might be able to reduce the size of your labels by limiting decimals or (if your values are very large) by showing your values x1000 or something like that, or by changing the font size.
Another solution would be to move your legend around by clicking on the chart and holding ctrl+shift. Some red lines will show that allow you to resize the individual parts of your chart. You could also limit the length of your legend in Chart properties > Presentation tab > Limit legend (characters).
Hope this helps you. Remember to mark a comment as the correct answer if your question was answered 
- Mark as New
- Bookmark
- Subscribe
- Mute
- Subscribe to RSS Feed
- Permalink
- Report Inappropriate Content
I'm only getting an option to "Mark as Helpful" for some reason which I already did. Thanks a lot for your help.