Unlock a world of possibilities! Login now and discover the exclusive benefits awaiting you.
- Qlik Community
- :
- All Forums
- :
- QlikView App Dev
- :
- How to show correctly % of Absences in Total workf...
- Subscribe to RSS Feed
- Mark Topic as New
- Mark Topic as Read
- Float this Topic for Current User
- Bookmark
- Subscribe
- Mute
- Printer Friendly Page
- Mark as New
- Bookmark
- Subscribe
- Mute
- Subscribe to RSS Feed
- Permalink
- Report Inappropriate Content
How to show correctly % of Absences in Total workforce?
Hello,
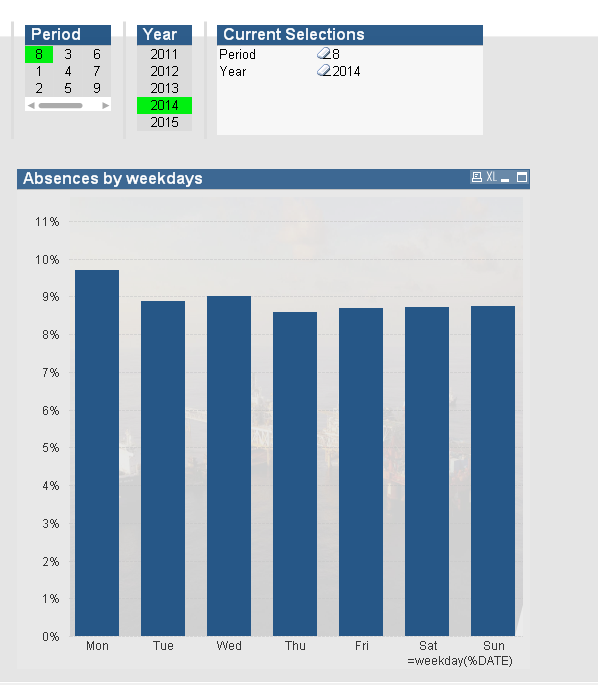
I am trying to create a chart which would show what was the percentage of absences among workforce for given weekday.
I have written such expression as a start but it is not correct as when selecting broader time range absences just cumulate and percentage rises:
count ({$<IsFuturePeriod={0}>} [#Absence Days])/count({$<IsFuturePeriod={0}>} DISTINCT %PersonnelNumber)
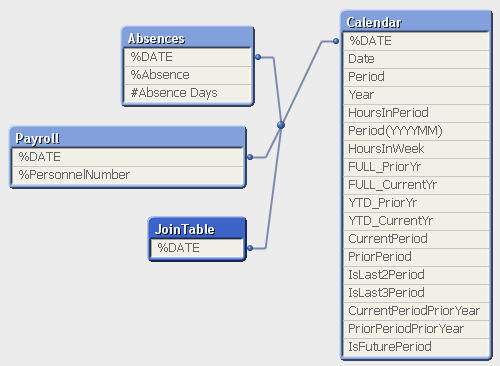
I am attaching the screens with data model.
Thank you,
Mat
Accepted Solutions
- Mark as New
- Bookmark
- Subscribe
- Mute
- Subscribe to RSS Feed
- Permalink
- Report Inappropriate Content
Hello,
It seems normal to accumulate, isn't it?
You would need an average %.
Try something like :
avg(AGGR(count ({$<IsFuturePeriod={0}>} [#Absence Days])/count({$<IsFuturePeriod={0}>} DISTINCT %PersonnelNumber),%DATE) )
BR
Serhan
- Mark as New
- Bookmark
- Subscribe
- Mute
- Subscribe to RSS Feed
- Permalink
- Report Inappropriate Content
Thanks Serham, that is what I needed.