Unlock a world of possibilities! Login now and discover the exclusive benefits awaiting you.
- Qlik Community
- :
- All Forums
- :
- QlikView App Dev
- :
- How to show dimension values as columns in pivot t...
- Subscribe to RSS Feed
- Mark Topic as New
- Mark Topic as Read
- Float this Topic for Current User
- Bookmark
- Subscribe
- Mute
- Printer Friendly Page
- Mark as New
- Bookmark
- Subscribe
- Mute
- Subscribe to RSS Feed
- Permalink
- Report Inappropriate Content
How to show dimension values as columns in pivot table
I have the following inline table:
Load * Inline [
Id,Batch,Product,Tree
1,A Batch,Apples,Level 1
2,B Batch,Cookies,Level 2
3,C Batch,Cake,Level 3
4,A Batch,Apples,Level 1
5,D Batch,Cookies,Level 3
6,E Batch,Apples,Level 1
7,F Batch,Cookies,Level 2
8,G Batch,Cake,Level 3
9,H Batch,Apples,Level 1
10,I Batch,Cookies,Level 3
];
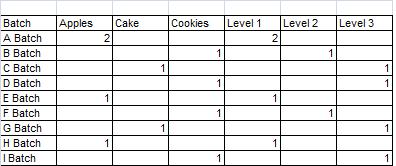
I want the output in the bellow format:

By using Generic load will give me the above output ? I appreciate your time...
Thanks
- « Previous Replies
-
- 1
- 2
- Next Replies »
Accepted Solutions
- Mark as New
- Bookmark
- Subscribe
- Mute
- Subscribe to RSS Feed
- Permalink
- Report Inappropriate Content
- Mark as New
- Bookmark
- Subscribe
- Mute
- Subscribe to RSS Feed
- Permalink
- Report Inappropriate Content
Is this something that you may be able to accomplish with a crosstable?
- Mark as New
- Bookmark
- Subscribe
- Mute
- Subscribe to RSS Feed
- Permalink
- Report Inappropriate Content
Carlos,
No Cross table will not help.
Thanks
- Mark as New
- Bookmark
- Subscribe
- Mute
- Subscribe to RSS Feed
- Permalink
- Report Inappropriate Content
Dimensions are Batch,Product tree
Expression as =count(distinct Id)
once you created like this just drag and drop (Select the filed name with your mouse so it shows in a Red color border and drag that filed into right hand side)your Product and tree dimensions into Columns .
- Mark as New
- Bookmark
- Subscribe
- Mute
- Subscribe to RSS Feed
- Permalink
- Report Inappropriate Content
Rama,
This will not give the output the way I want my final output.
Thanks.
- Mark as New
- Bookmark
- Subscribe
- Mute
- Subscribe to RSS Feed
- Permalink
- Report Inappropriate Content
What you try to do is turn both product and tree into a single dimension, correct?
- Mark as New
- Bookmark
- Subscribe
- Mute
- Subscribe to RSS Feed
- Permalink
- Report Inappropriate Content
Peter,
I want to turn the values in Product and Tree dimension into columns as shown in my final output. is this possible ?
Thanks
- Mark as New
- Bookmark
- Subscribe
- Mute
- Subscribe to RSS Feed
- Permalink
- Report Inappropriate Content
If so, then the easiest thing to do would be to split product and tree into separate rows, with an indicator that tells you which of the two dimensions is used in a particular row Like in:
SpecialTable:
NOCONCATENATE
LOAD Id, Batch, Product As Dimension, 'Product' as DimensionType
RESIDENT SourceTable;
CONCATENATE (SpecialTable)
LOAD Id, Batch, Tree As Dimension, 'Tree' as DimensionType
RESIDENT SourceTable;
You can use this table for just the pivot output, or for various other things by manipulating the DimensionType in Set Analysis.
- Mark as New
- Bookmark
- Subscribe
- Mute
- Subscribe to RSS Feed
- Permalink
- Report Inappropriate Content
This could be one option
- Mark as New
- Bookmark
- Subscribe
- Mute
- Subscribe to RSS Feed
- Permalink
- Report Inappropriate Content
Hi,
Am I correct?? Do you want like this result???

- « Previous Replies
-
- 1
- 2
- Next Replies »