Unlock a world of possibilities! Login now and discover the exclusive benefits awaiting you.
- Qlik Community
- :
- All Forums
- :
- QlikView App Dev
- :
- How to show discontinuous line in line chart.
- Subscribe to RSS Feed
- Mark Topic as New
- Mark Topic as Read
- Float this Topic for Current User
- Bookmark
- Subscribe
- Mute
- Printer Friendly Page
- Mark as New
- Bookmark
- Subscribe
- Mute
- Subscribe to RSS Feed
- Permalink
- Report Inappropriate Content
How to show discontinuous line in line chart.
Hi,
I am facing the issue while showing discontinuous line in line chart with multiple dimensions.
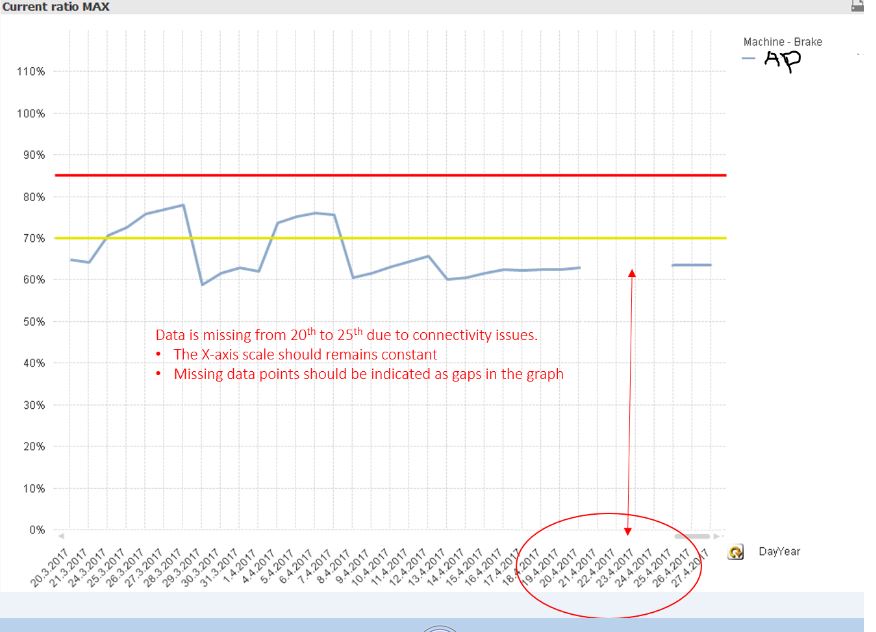
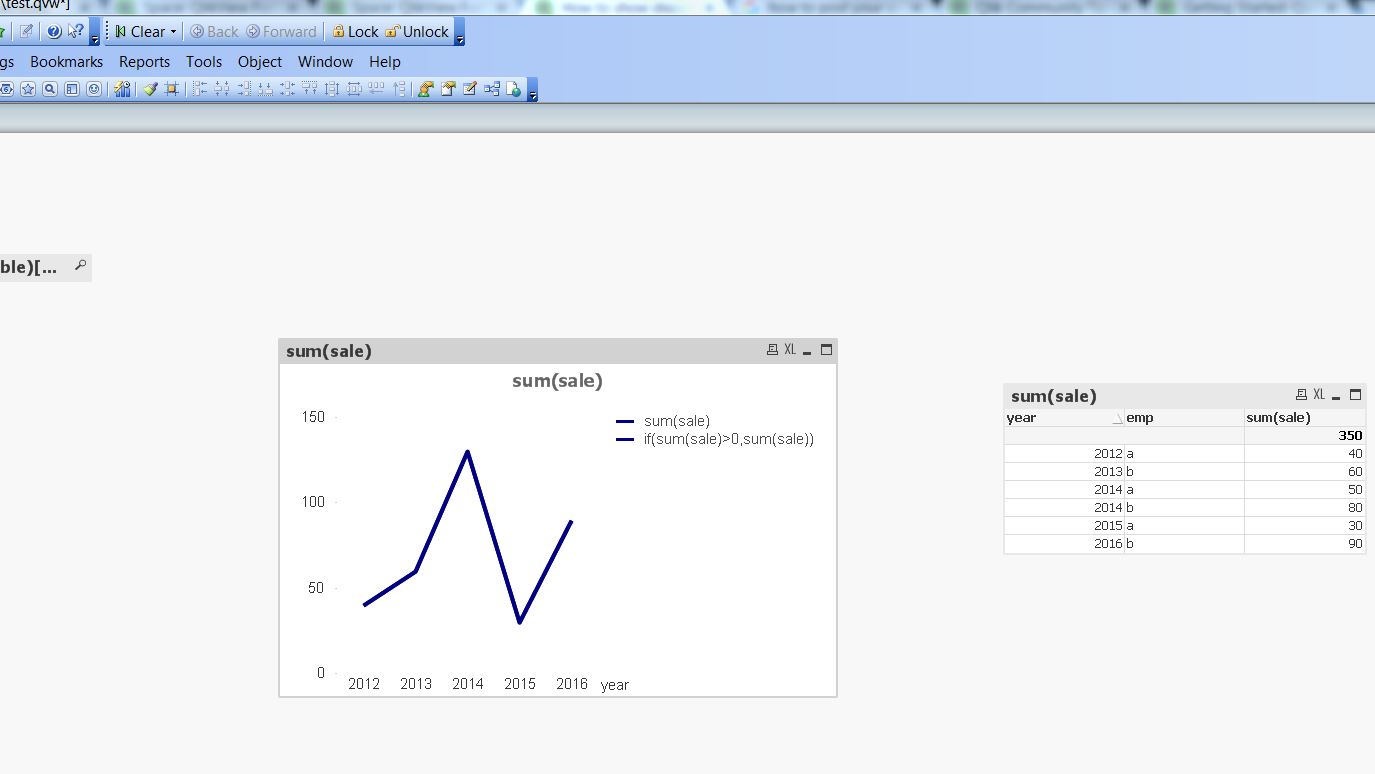
I want to show the break in line chart where the data is missing for the particular x axis value and in my chart I have multiple dimensions. Please see image abc.jpg where I am not able to show the break for missing data.
The expected would be like this.< fixed.jpg>
Please refer attached my sample application <test.qvw>.
Please provide me solution to achieve this in Qlikview.
Thanks
Sarojani
- Mark as New
- Bookmark
- Subscribe
- Mute
- Subscribe to RSS Feed
- Permalink
- Report Inappropriate Content
Hi Sarojani,
In your example screenshot, you used date as dimension but in your attached qlikview file year is used as dimension.
can you upload your example with dates as dimension??
Siva
- Mark as New
- Bookmark
- Subscribe
- Mute
- Subscribe to RSS Feed
- Permalink
- Report Inappropriate Content
You can use JOIN in your load statement with. In dimension X properties, check "display all vales" and in presentation uncheck "suppress missing data". I have changed year by date:
load * inline [
emp,date, sale
a, 19/04/2017, 40
a, 20/04/2017, 50
a, 25/04/2017, 30
b, 26/04/2017, 80
b, 27/04/2017, 90];
RIGHT JOIN(SALES)
load * inline [
Date
19/04/2017
20/04/2017
21/04/2017
22/04/2017
23/04/2017
24/04/2017
25/04/2017
26/04/2017
27/04/2017
];
- Mark as New
- Bookmark
- Subscribe
- Mute
- Subscribe to RSS Feed
- Permalink
- Report Inappropriate Content
Hi,
I have used just year instead of date still it is not working.
Thanks
Sarojani
- Mark as New
- Bookmark
- Subscribe
- Mute
- Subscribe to RSS Feed
- Permalink
- Report Inappropriate Content
Hi Sarojani,
If the dimension you are using as 'Date' (X axis) does not have the values it will not show them.
You should have a Master Calendar so you can track when the values are missing.
Carlos M