Unlock a world of possibilities! Login now and discover the exclusive benefits awaiting you.
- Qlik Community
- :
- All Forums
- :
- QlikView App Dev
- :
- How to show every single month of the last year?
- Subscribe to RSS Feed
- Mark Topic as New
- Mark Topic as Read
- Float this Topic for Current User
- Bookmark
- Subscribe
- Mute
- Printer Friendly Page
- Mark as New
- Bookmark
- Subscribe
- Mute
- Subscribe to RSS Feed
- Permalink
- Report Inappropriate Content
How to show every single month of the last year?
Hi All
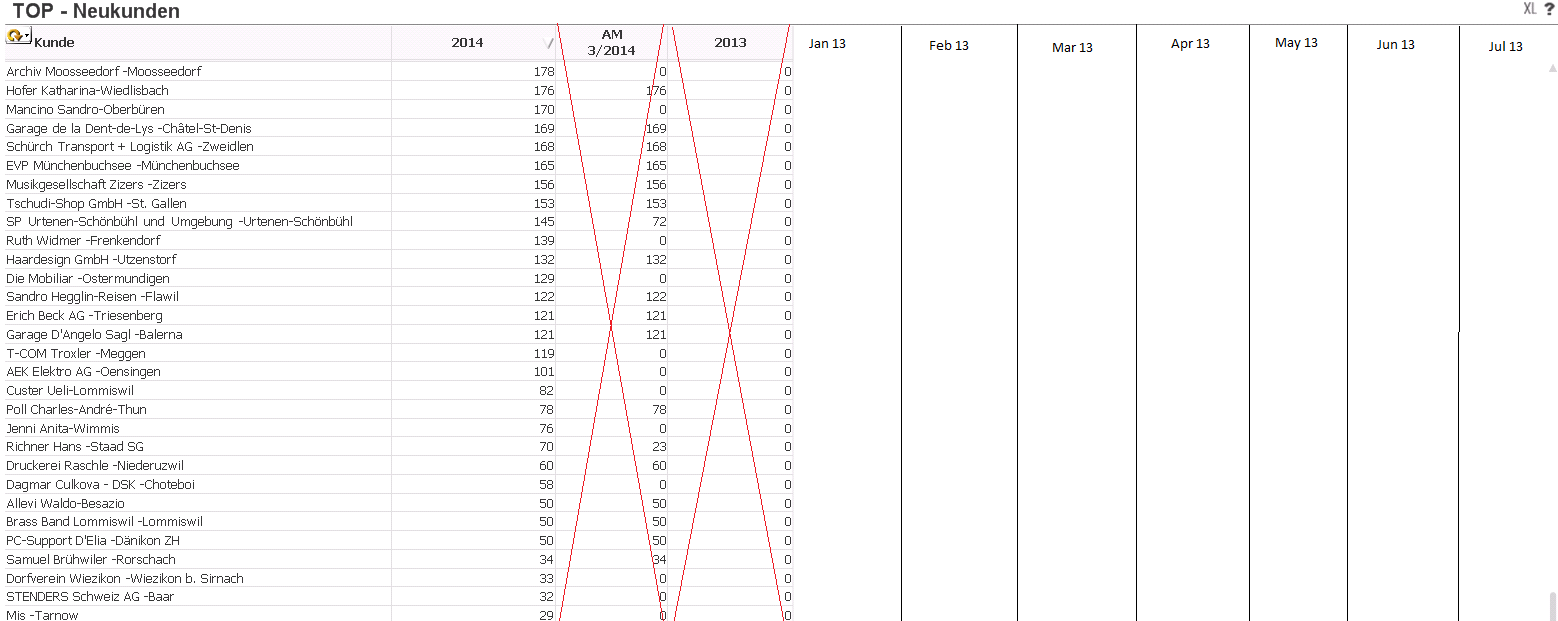
I've got a List for our sales, it shows the actually year (like 2014) in one colum.
And in the other colums it should show every single month of the last year.
Let's show this a little bit better:
Client / sales 2014 / Jan 13 / Feb 13 / Mar 13 etc.
I'm really thankful for any help.
Nice day to all!
Dominik
- Tags:
- single_months
- « Previous Replies
-
- 1
- 2
- Next Replies »
- Mark as New
- Bookmark
- Subscribe
- Mute
- Subscribe to RSS Feed
- Permalink
- Report Inappropriate Content
Use pivot table for this like
Dimension:- Client
Dimension :- MonthYear
Expression Sales2014
and drag the Monthyear field to the upper right corer and when you see horizontal blue arrow drag the field therer.
- Mark as New
- Bookmark
- Subscribe
- Mute
- Subscribe to RSS Feed
- Permalink
- Report Inappropriate Content
Use Year and month as dimension and sum(sales) as expression (your expression).
Create a pivot table, then drag the month field to the head of the table (until you see an horizonatal line)
Let me know
- Mark as New
- Bookmark
- Subscribe
- Mute
- Subscribe to RSS Feed
- Permalink
- Report Inappropriate Content
you can create 'Sales 2014' as Dimension (Calculated dimension) and rest as usual pivot table dimension values..
Regards,
Karthik
- Mark as New
- Bookmark
- Subscribe
- Mute
- Subscribe to RSS Feed
- Permalink
- Report Inappropriate Content
And expression level you can do like
Dimension:- Client
Expression Sales2014
Expression :- Sum( {<NumMonth = {'$(=Month(Today())-3)'} >} Sales)
Expression:- Sum( {<NumMonth = {'$(=Month(Today())-2)'} >} Sales)
Expression:- Sum( {<NumMonth = {'$(=Month(Today())-1)'} >} Sales)
Expression:- Sum( {<NumMonth = {'$(=Month(Today()))'} >} Sales)
- Mark as New
- Bookmark
- Subscribe
- Mute
- Subscribe to RSS Feed
- Permalink
- Report Inappropriate Content
Hi Alessandro
The problem is, i've got a selected year (2014).
And because of the selected year it only shows the months of this year. But i want every single month of the last year to show.
See the picture below
Kind regards
- Mark as New
- Bookmark
- Subscribe
- Mute
- Subscribe to RSS Feed
- Permalink
- Report Inappropriate Content
Let's suppose that your expression is Sum(Sales) and that your dimensions are year and month then write:
Sum({$ <month=>}Sales)
Let me know please
- Mark as New
- Bookmark
- Subscribe
- Mute
- Subscribe to RSS Feed
- Permalink
- Report Inappropriate Content
Sorry
Sum({$ <year=>}Sales)
- Mark as New
- Bookmark
- Subscribe
- Mute
- Subscribe to RSS Feed
- Permalink
- Report Inappropriate Content
Year and month as dimension and ur expression sum({$<year=,month=>}sales)
- Mark as New
- Bookmark
- Subscribe
- Mute
- Subscribe to RSS Feed
- Permalink
- Report Inappropriate Content
pls take a look at the example.
- « Previous Replies
-
- 1
- 2
- Next Replies »