Unlock a world of possibilities! Login now and discover the exclusive benefits awaiting you.
- Qlik Community
- :
- All Forums
- :
- QlikView App Dev
- :
- How to show every single month of the last year?
- Subscribe to RSS Feed
- Mark Topic as New
- Mark Topic as Read
- Float this Topic for Current User
- Bookmark
- Subscribe
- Mute
- Printer Friendly Page
- Mark as New
- Bookmark
- Subscribe
- Mute
- Subscribe to RSS Feed
- Permalink
- Report Inappropriate Content
How to show every single month of the last year?
Hi All
I've got a List for our sales, it shows the actually year (like 2014) in one colum.
And in the other colums it should show every single month of the last year.
Let's show this a little bit better:
Client / sales 2014 / Jan 13 / Feb 13 / Mar 13 etc.
I'm really thankful for any help.
Nice day to all!
Dominik
- Tags:
- single_months
- « Previous Replies
-
- 1
- 2
- Next Replies »
- Mark as New
- Bookmark
- Subscribe
- Mute
- Subscribe to RSS Feed
- Permalink
- Report Inappropriate Content
Dear Sudeep
Thanks for the example.
But when I select a year in your example, it shows me the 2013 no more.
Kind regards
- Mark as New
- Bookmark
- Subscribe
- Mute
- Subscribe to RSS Feed
- Permalink
- Report Inappropriate Content
it is dynamic. If you select year as 2013 or if you select any dates that is under 2013 then the table will show all the 2013 date related data same works for when you select year as 2014.
Do you want to show the table all data irrespective of any date selection?
- Mark as New
- Bookmark
- Subscribe
- Mute
- Subscribe to RSS Feed
- Permalink
- Report Inappropriate Content
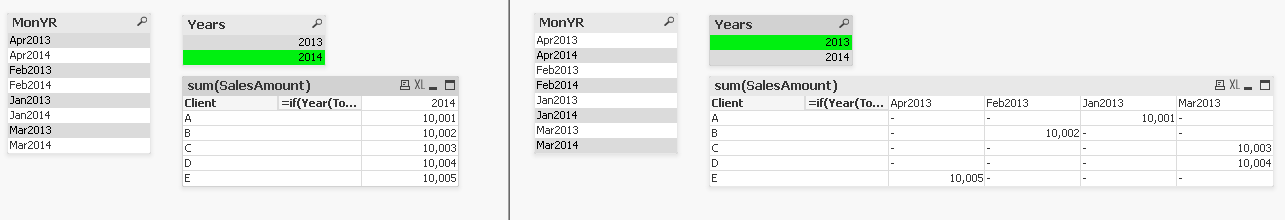
The point is, mostly the selected year is 2014 (like in the left side of your picture)
And thats the point. It should show me nevertheless the 2013, also when the selected year is 2014.
But many many thanks for your help!
- Mark as New
- Bookmark
- Subscribe
- Mute
- Subscribe to RSS Feed
- Permalink
- Report Inappropriate Content
Try like below
For Month year dimension write like calculated dimension
Dimension1:- Client
Dimension2:- =if(GetFieldSelections(Years)=Years, MonYR, if(Year(Today())=Years,Year(Today()),MonYR))
Expression:- sum(SalesAmount)
- Mark as New
- Bookmark
- Subscribe
- Mute
- Subscribe to RSS Feed
- Permalink
- Report Inappropriate Content
You can use an expression like sum({<Years=, MonYR= >}SalesAmount) in that table after which even if you select any year or month year the table remain shows for 2014 and 2013.
- « Previous Replies
-
- 1
- 2
- Next Replies »