Unlock a world of possibilities! Login now and discover the exclusive benefits awaiting you.
- Qlik Community
- :
- All Forums
- :
- QlikView App Dev
- :
- Re: How to show line and bar values in combo chart
- Subscribe to RSS Feed
- Mark Topic as New
- Mark Topic as Read
- Float this Topic for Current User
- Bookmark
- Subscribe
- Mute
- Printer Friendly Page
- Mark as New
- Bookmark
- Subscribe
- Mute
- Subscribe to RSS Feed
- Permalink
- Report Inappropriate Content
How to show line and bar values in combo chart
Hello Experts,
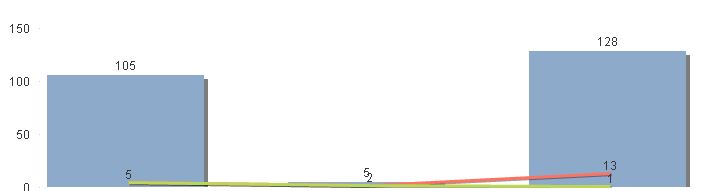
I have a combo chart, In this chart i have added two lines and selected value on data points. But values are coming like this both line values are showing in same place. Can you guys suggest me how to set in a proper way
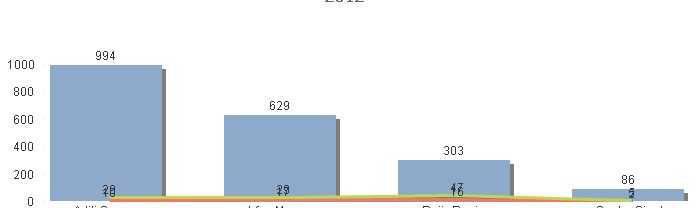
Here two line values are same 5 on 1st bar, how to show two 5's individually.
For 2nd bar, bar values is 5 line values are 2 so both values showing in same place.
Please suggest how to arrange the values in proper and understandable way
Thank you in advance
Accepted Solutions
- Mark as New
- Bookmark
- Subscribe
- Mute
- Subscribe to RSS Feed
- Permalink
- Report Inappropriate Content
Hi Sudhakar ,
You can change position of Expressions Left or Right.
Properties -> Axes-> Positions.
Raman Rastogi
- Mark as New
- Bookmark
- Subscribe
- Mute
- Subscribe to RSS Feed
- Permalink
- Report Inappropriate Content
Hi Sudhakar ,
You can change position of Expressions Left or Right.
Properties -> Axes-> Positions.
Raman Rastogi
- Mark as New
- Bookmark
- Subscribe
- Mute
- Subscribe to RSS Feed
- Permalink
- Report Inappropriate Content
Hi Raman,
Thank you very much for the solution