Unlock a world of possibilities! Login now and discover the exclusive benefits awaiting you.
- Qlik Community
- :
- All Forums
- :
- QlikView App Dev
- :
- Re: How to show only Top 10 values in pivot table
- Subscribe to RSS Feed
- Mark Topic as New
- Mark Topic as Read
- Float this Topic for Current User
- Bookmark
- Subscribe
- Mute
- Printer Friendly Page
- Mark as New
- Bookmark
- Subscribe
- Mute
- Subscribe to RSS Feed
- Permalink
- Report Inappropriate Content
How to show only Top 10 values in pivot table
Hi Frnz,
Please help me. I would like display Top 10 values. But I am getting all values. Please find the attached QVW.
- « Previous Replies
-
- 1
- 2
- Next Replies »
- Mark as New
- Bookmark
- Subscribe
- Mute
- Subscribe to RSS Feed
- Permalink
- Report Inappropriate Content
Hi Manish.,
I am not getting..Can you please tell me which one i have to take in expression tab
- Mark as New
- Bookmark
- Subscribe
- Mute
- Subscribe to RSS Feed
- Permalink
- Report Inappropriate Content
Trying to get this?
- Mark as New
- Bookmark
- Subscribe
- Mute
- Subscribe to RSS Feed
- Permalink
- Report Inappropriate Content
Hi ,
Try this
=if(aggr(rank(sum(Cost)),Year)<=10,Account_Name)
- Mark as New
- Bookmark
- Subscribe
- Mute
- Subscribe to RSS Feed
- Permalink
- Report Inappropriate Content
Use Pivot Table
Dimension
1) YEAR
2) Calculated DImension
=AGGR(IF(Rank(SUM(ULT_REVENUE),4)<=10,L4ACCTNAME),YEAR, L4ACCTNAME)
TICK SUPPRESS WHEN VALUE IS NULL
Expression
Whatever you want
- Mark as New
- Bookmark
- Subscribe
- Mute
- Subscribe to RSS Feed
- Permalink
- Report Inappropriate Content
Hi SunIndia,
Thanks for your Answer. This expression also working.
- Mark as New
- Bookmark
- Subscribe
- Mute
- Subscribe to RSS Feed
- Permalink
- Report Inappropriate Content
No problem 
I am glad we were able to help.
Best,
Sunny
- Mark as New
- Bookmark
- Subscribe
- Mute
- Subscribe to RSS Feed
- Permalink
- Report Inappropriate Content
Hi SunIndia,
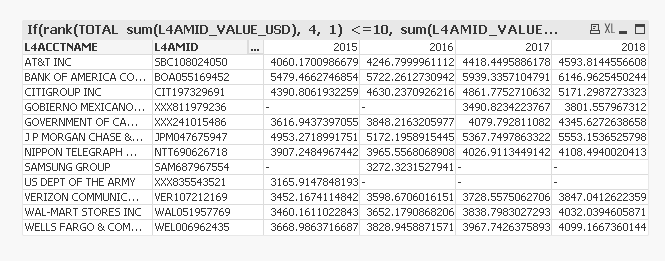
May I know why are you using ** 4,1** in that expression.Can you please let me know.It is working nice. I would like to know please.
If(rank(TOTAL sum(L4AMID_VALUE_USD),4,1) <=15, sum(L4AMID_VALUE_USD))
- Mark as New
- Bookmark
- Subscribe
- Mute
- Subscribe to RSS Feed
- Permalink
- Report Inappropriate Content
rank([ total ] expression [ , mode [, format ] ])
Evaluates expression, compares the result with the result of the other rows containing the current column segment and returns the ranking of the current row within the segment. For bitmap charts, the current column segment is defined as it appears in the chart's straight table equivalent (Actually all QlikView charts have a straight table equivalent with the exception of the pivot table which has a more complex structure).
If the chart is one-dimensional or if the expression is preceded by the total qualifier, the current column segment is always equal to the entire column. If the table or table equivalent has multiple vertical dimensions, the current column segment will include only rows with the same values as the current row in all dimension columns except for the column showing the last dimension in the inter field sort order.
The ranking is returned as a dual value, which in the case when each row has a unique ranking will be an integer between 1 and the number of rows in the current column segment.
In the case where several rows share the same ranking, the text and number representation can be controlled as follows:
The second parameter mode specifies the number representation of the function result.
mode
| 0 (default) | If all ranks within the sharing group fall on the low side of the middle value of the entire ranking, all rows get the lowest rank within the sharing group. If all ranks within the sharing group fall on the high side of the middle value of the entire ranking, all rows get the highest rank within the sharing group. If ranks within the sharing group span over the middle value of the entire ranking, all rows get the value corresponding to the average of the top and bottom ranking in the entire column segment. |
| 1 | Lowest rank on all rows. |
| 2 | Average rank on all rows. |
| 3 | Highest rank on all rows. |
| 4 | Lowest rank on first row, then incremented by one for each row. |
The third parameter format specifies the text representation of the function result.
format
| 0 (default) | Low value&' - '&high value on all rows (e.g. 3 - 4). |
| 1 | Low value on all rows. |
| 2 | Low value on first row, blank on the following rows. |
The order of rows for mode 4 and format 2 is determined by the sort order of the chart dimensions.
- Mark as New
- Bookmark
- Subscribe
- Mute
- Subscribe to RSS Feed
- Permalink
- Report Inappropriate Content
Hi Manish,
Thanks for your explanation. Now I got idea.
- « Previous Replies
-
- 1
- 2
- Next Replies »