Unlock a world of possibilities! Login now and discover the exclusive benefits awaiting you.
- Qlik Community
- :
- All Forums
- :
- QlikView App Dev
- :
- Re: How to show only certain labels and data?
- Subscribe to RSS Feed
- Mark Topic as New
- Mark Topic as Read
- Float this Topic for Current User
- Bookmark
- Subscribe
- Mute
- Printer Friendly Page
- Mark as New
- Bookmark
- Subscribe
- Mute
- Subscribe to RSS Feed
- Permalink
- Report Inappropriate Content
How to show only certain labels and data?
Hi there,
I am new to Qlikview. I have created a chart but i am having problems with getting only certain info to display.
If you look in the sample data I have provided you will see that the chart currently shows all products(1,2,3,4 etc) under each company (A,B,C,D)
I would like to have only relevant products showing under each heading. So for instance Company B, only show product 3 and 4.
How can I do this?
Cheers.
- Mark as New
- Bookmark
- Subscribe
- Mute
- Subscribe to RSS Feed
- Permalink
- Report Inappropriate Content
How many companies do you have and do they change in the date much?
These are 4 separate objects each filtered for a different company
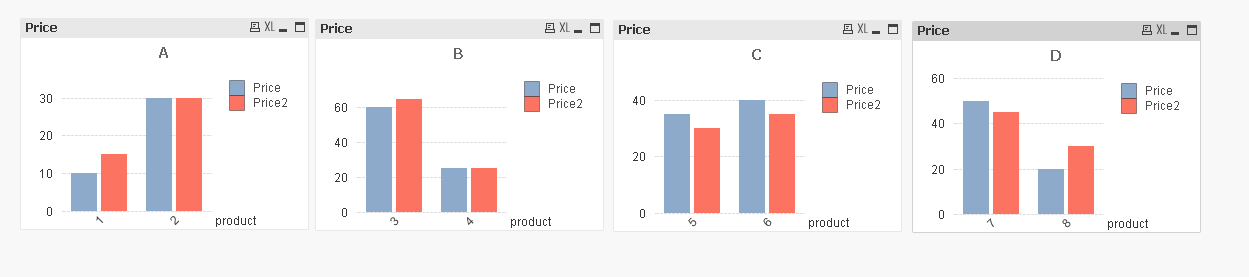
In a grouped bar chart with 2 dimensions you can't suppress the values from the 2nd dimension where expression are zeroes...it will show the whole group each time.
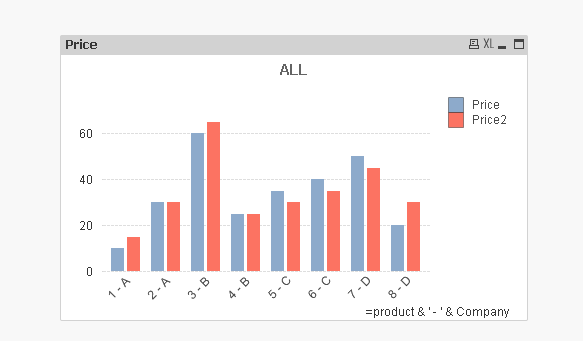
Or you can concatenate the 2 dimensions together and get what you want with a different axis layout:
- Mark as New
- Bookmark
- Subscribe
- Mute
- Subscribe to RSS Feed
- Permalink
- Report Inappropriate Content
Thankyou this is really helpful.
Max 4 companies but a lot of products. Ideally I'd like to keep everything in the one chart as this is part of a larger dashboard and it's important to clearly see how our company compares to the other 3 competitors. That's why I had a trellis in mine.
Edit: Just to note i am open to how the data can be displayed and what kind of chart it is. I just picked bar chart to give an example.