Unlock a world of possibilities! Login now and discover the exclusive benefits awaiting you.
- Qlik Community
- :
- All Forums
- :
- QlikView App Dev
- :
- Re: How to show only increased rows or data
- Subscribe to RSS Feed
- Mark Topic as New
- Mark Topic as Read
- Float this Topic for Current User
- Bookmark
- Subscribe
- Mute
- Printer Friendly Page
- Mark as New
- Bookmark
- Subscribe
- Mute
- Subscribe to RSS Feed
- Permalink
- Report Inappropriate Content
How to show only increased rows or data
Hi there,
I am trying to find a way to filter my data so that I can find the items with increase sales over the years. Here is a snapshot of my straight table:
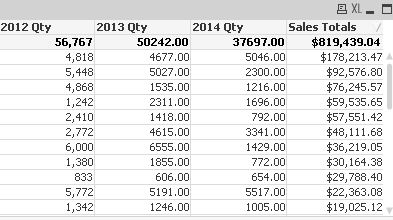
How can I filter it so that table only shows the increased quantities year over year?
For instance, which items increase from 2012 to 2013 to 2014.
Is it possible to find which items increase from 2012 to 2013 but decrease in 2014?
Are these kind of filtering possible?
Accepted Solutions
- Mark as New
- Bookmark
- Subscribe
- Mute
- Subscribe to RSS Feed
- Permalink
- Report Inappropriate Content
You mean Personal Desktop, no license? OK, I'll try to describe:
1. I added the script:
Filter:
load * inline [
F
'All'
'Increase'
'Decrease in 2014'
];
2. Assuming the amount fields for the years are named "2012", "2013", and "2014", I've created a calculated dimension:
if(F='All, Dim,
if(F='Increase', aggr(if(sum("2013")>sum("2012") and sum("2014")>sum("2013"), Dim), Dim),
if(F='Decrease in 2014', aggr(if(sum("2013")>sum("2012) and sum("2014")<sum("2013"), Dim), Dim)
)))
and, check the box 'Suppress when value is null'
3. Bring the F field on the front end, select one value, go to its properties, and check 'Always one selected value' on the General tab.
Hope it helps
- Mark as New
- Bookmark
- Subscribe
- Mute
- Subscribe to RSS Feed
- Permalink
- Report Inappropriate Content
It is possible.
First, I'd create an additional filed for tis filter, with values like 'All', 'Increase', 'Decrease in 2014'. Make it "only one value selected"
Second, create a conditional calculated dimension in the chart which show all rows, or only if increase through all years, or decrease in 2014, depending on the above filter.
Hope this idea is enough for you to proceed. If not, please upload a small example of your app, and I'll try it if I have time.
- Mark as New
- Bookmark
- Subscribe
- Mute
- Subscribe to RSS Feed
- Permalink
- Report Inappropriate Content
Michael,
Thanks for the response but since I am really new to qv, I believe this task is beyond my current skills. I'd appreciate if you could give me an example.
Cheers
- Mark as New
- Bookmark
- Subscribe
- Mute
- Subscribe to RSS Feed
- Permalink
- Report Inappropriate Content
Korhan,
See attached. Take a look at the calculated dimension.
Regards,
Michael
- Mark as New
- Bookmark
- Subscribe
- Mute
- Subscribe to RSS Feed
- Permalink
- Report Inappropriate Content
Michael,
Thanks for the response.
I am using the desktop version and cannot open someone else's files.
Don't know if there is a way to do this.
Sorry!
- Mark as New
- Bookmark
- Subscribe
- Mute
- Subscribe to RSS Feed
- Permalink
- Report Inappropriate Content
Never mind. Got it.
Thanks.
- Mark as New
- Bookmark
- Subscribe
- Mute
- Subscribe to RSS Feed
- Permalink
- Report Inappropriate Content
You mean Personal Desktop, no license? OK, I'll try to describe:
1. I added the script:
Filter:
load * inline [
F
'All'
'Increase'
'Decrease in 2014'
];
2. Assuming the amount fields for the years are named "2012", "2013", and "2014", I've created a calculated dimension:
if(F='All, Dim,
if(F='Increase', aggr(if(sum("2013")>sum("2012") and sum("2014")>sum("2013"), Dim), Dim),
if(F='Decrease in 2014', aggr(if(sum("2013")>sum("2012) and sum("2014")<sum("2013"), Dim), Dim)
)))
and, check the box 'Suppress when value is null'
3. Bring the F field on the front end, select one value, go to its properties, and check 'Always one selected value' on the General tab.
Hope it helps
- Mark as New
- Bookmark
- Subscribe
- Mute
- Subscribe to RSS Feed
- Permalink
- Report Inappropriate Content
This is really good. Thank you so much for sharing your knowledge.
I really appreciate it.
- Mark as New
- Bookmark
- Subscribe
- Mute
- Subscribe to RSS Feed
- Permalink
- Report Inappropriate Content
Michael,
What does 'dim' do here? Can you explain a little bit or can you point me to a link where I can read?
Thx.
- Mark as New
- Bookmark
- Subscribe
- Mute
- Subscribe to RSS Feed
- Permalink
- Report Inappropriate Content
Also, never mind this too. I figured it out.
Thanks again.