Unlock a world of possibilities! Login now and discover the exclusive benefits awaiting you.
- Qlik Community
- :
- All Forums
- :
- QlikView App Dev
- :
- Re: How to show the legend in horizontal Row
- Subscribe to RSS Feed
- Mark Topic as New
- Mark Topic as Read
- Float this Topic for Current User
- Bookmark
- Subscribe
- Mute
- Printer Friendly Page
- Mark as New
- Bookmark
- Subscribe
- Mute
- Subscribe to RSS Feed
- Permalink
- Report Inappropriate Content
How to show the legend in horizontal Row
Hello Experts,
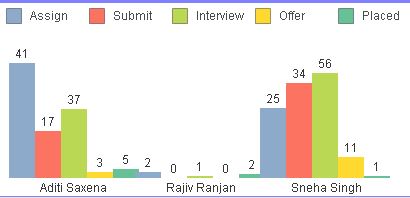
I want to show my Legend in horizontal row i tried but it is not showing..... It is showing in vertical single.
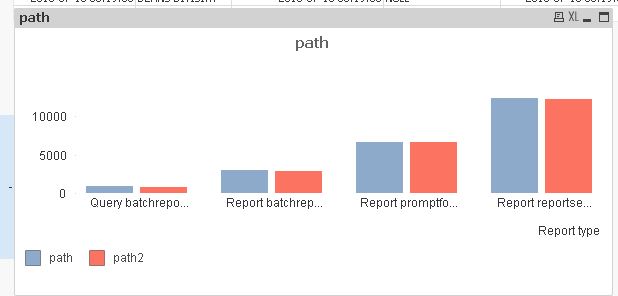
I want it in like second picture

I Tried Control Shift option also
And How to show our data labels names with values in pie chart. Actually what i created is this
But I want like this only

If it is possible can you guys please suggest me how to do
Thank you in advance
- « Previous Replies
-
- 1
- 2
- Next Replies »
- Mark as New
- Bookmark
- Subscribe
- Mute
- Subscribe to RSS Feed
- Permalink
- Report Inappropriate Content
Hi Sudhakar,
I think we can not change legend position through expression.
For More Details See Link Below.
Best
Raman
- Mark as New
- Bookmark
- Subscribe
- Mute
- Subscribe to RSS Feed
- Permalink
- Report Inappropriate Content
as manoj say, the Box will get much wider, from side to side in chart. After that decrease the size of the red Box by draging it from bottom. This is a little bit tricky so have patience.
- Mark as New
- Bookmark
- Subscribe
- Mute
- Subscribe to RSS Feed
- Permalink
- Report Inappropriate Content
Your second requirement do you want to show the values as well as expression right?
like .net 50
power bi 75
consulting 80
if in this manner means its not possible but there is away.
you can concatenate the values with expression then call it as dimension in pie chart and dont show the values on data points.
it will work for this requirement
- Mark as New
- Bookmark
- Subscribe
- Mute
- Subscribe to RSS Feed
- Permalink
- Report Inappropriate Content
This is not working for me in a pie chart the same way as in a barchart, dont know why.
- Mark as New
- Bookmark
- Subscribe
- Mute
- Subscribe to RSS Feed
- Permalink
- Report Inappropriate Content
rearrange the size of bar chart.the red box will not overlap on each other first resize the chart then drag the legend at bottom then the box will become wider
- Mark as New
- Bookmark
- Subscribe
- Mute
- Subscribe to RSS Feed
- Permalink
- Report Inappropriate Content
I made whatever you suggested but here i am getting one more problem all charts are attaching i want gap between dimension names if i change in Bar settings under presentation tab then all bars are separating and giving confusion to users
I want some big gap between 5 charts after and 5 charts after
- Mark as New
- Bookmark
- Subscribe
- Mute
- Subscribe to RSS Feed
- Permalink
- Report Inappropriate Content
- Mark as New
- Bookmark
- Subscribe
- Mute
- Subscribe to RSS Feed
- Permalink
- Report Inappropriate Content
try to increase Cluster Distance in presetation tab
- « Previous Replies
-
- 1
- 2
- Next Replies »