Unlock a world of possibilities! Login now and discover the exclusive benefits awaiting you.
- Qlik Community
- :
- All Forums
- :
- QlikView App Dev
- :
- Re: How to show values on dta points in chart
Options
- Subscribe to RSS Feed
- Mark Topic as New
- Mark Topic as Read
- Float this Topic for Current User
- Bookmark
- Subscribe
- Mute
- Printer Friendly Page
Turn on suggestions
Auto-suggest helps you quickly narrow down your search results by suggesting possible matches as you type.
Showing results for
Specialist
2017-09-17
01:03 PM
- Mark as New
- Bookmark
- Subscribe
- Mute
- Subscribe to RSS Feed
- Permalink
- Report Inappropriate Content
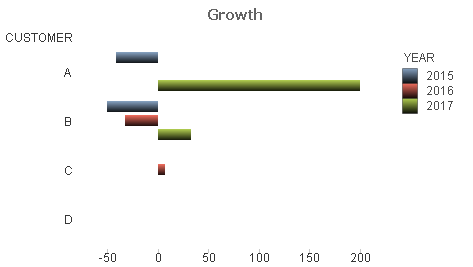
How to show values on dta points in chart
As per the chart, the growth rate to be stated on data points & appreciate if expressions is shown to accomodate this!
Regards
Neville
Alt((SUM(SALES)-Below(TOTAL SUM(SALES),Count(DISTINCT TOTAL<YEAR>CUSTOMER)))/Below(TOTAL SUM(SALES),Count(DISTINCT TOTAL<YEAR>CUSTOMER)),0)*100
391 Views
1 Solution
Accepted Solutions
Specialist III
2017-09-17
01:10 PM
- Mark as New
- Bookmark
- Subscribe
- Mute
- Subscribe to RSS Feed
- Permalink
- Report Inappropriate Content
324 Views
1 Reply
Specialist III
2017-09-17
01:10 PM
- Mark as New
- Bookmark
- Subscribe
- Mute
- Subscribe to RSS Feed
- Permalink
- Report Inappropriate Content
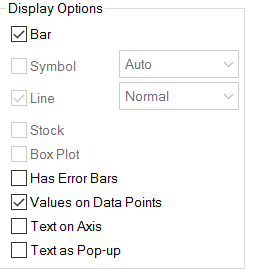
Try with Properties\Expressions and check "Value on Data points"
325 Views