Unlock a world of possibilities! Login now and discover the exclusive benefits awaiting you.
Announcements
See why Qlik is a Leader in the 2024 Gartner® Magic Quadrant™ for Analytics & BI Platforms.
Download Now
- Qlik Community
- :
- All Forums
- :
- QlikView App Dev
- :
- How to show values on pie chart (controlled by var...
Options
- Subscribe to RSS Feed
- Mark Topic as New
- Mark Topic as Read
- Float this Topic for Current User
- Bookmark
- Subscribe
- Mute
- Printer Friendly Page
Turn on suggestions
Auto-suggest helps you quickly narrow down your search results by suggesting possible matches as you type.
Showing results for
Not applicable
2013-04-30
06:29 AM
- Mark as New
- Bookmark
- Subscribe
- Mute
- Subscribe to RSS Feed
- Permalink
- Report Inappropriate Content
How to show values on pie chart (controlled by variable)
Hi all.
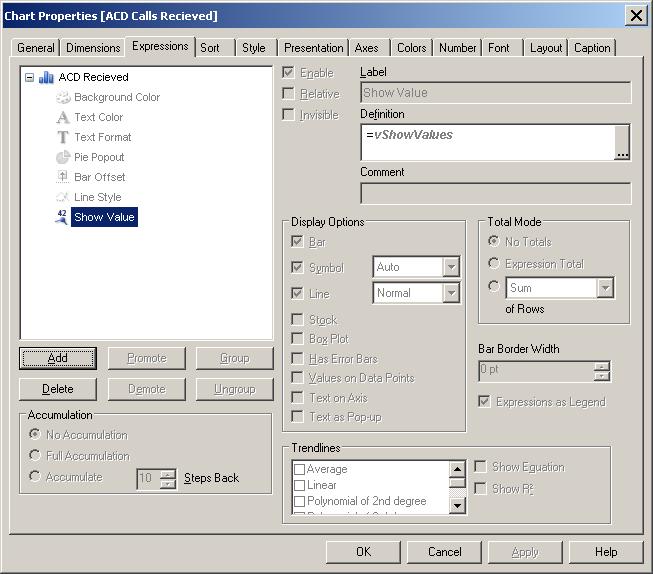
I have a variable (vShowValues) which is toggled between 1 and 0 by way of a button - it allows the user to control whether or not values are displayed on data points (see example screenshot below).
This works well for bar charts, however it doesn’t seem to work with pie charts – any idea what the problem could be?
Many thanks, Michael.
Example bar chart expression:
835 Views
2 Replies
Partner - Creator III
2013-04-30
06:37 AM
- Mark as New
- Bookmark
- Subscribe
- Mute
- Subscribe to RSS Feed
- Permalink
- Report Inappropriate Content
Hi Michael
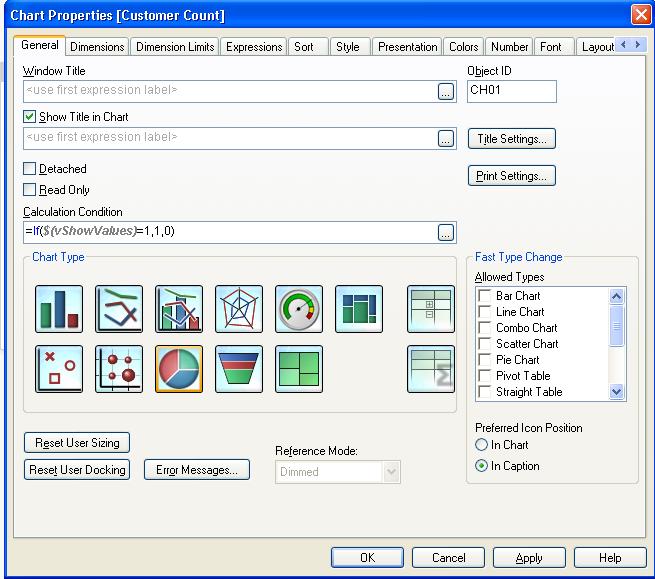
I usually use the calculation condition for this,
See screenshot:
Hope that helped
Ori
198 Views
Not applicable
2013-04-30
06:42 AM
Author
- Mark as New
- Bookmark
- Subscribe
- Mute
- Subscribe to RSS Feed
- Permalink
- Report Inappropriate Content
Thanks Ori – however shows/hides the entire pie chart based on the variable, rather than the values on data points.
198 Views