Unlock a world of possibilities! Login now and discover the exclusive benefits awaiting you.
- Qlik Community
- :
- All Forums
- :
- QlikView App Dev
- :
- Re: How to split each Pie Chart section
- Subscribe to RSS Feed
- Mark Topic as New
- Mark Topic as Read
- Float this Topic for Current User
- Bookmark
- Subscribe
- Mute
- Printer Friendly Page
- Mark as New
- Bookmark
- Subscribe
- Mute
- Subscribe to RSS Feed
- Permalink
- Report Inappropriate Content
How to split each Pie Chart section
Hello everyone,
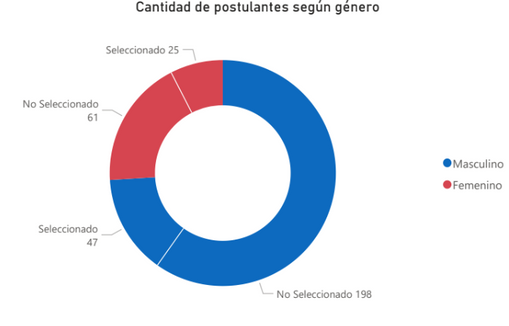
I'm working with a Pie Chart displaying how many Male and Female applicants we have had in our selection processes, and I want to split each gender into "selected" and "not selected", but I can't seem to find a way to achieve this.
I'm attaching a picture of this same idea but made in Power BI.
Is there any way to achieve this in QV? Thanks
- Mark as New
- Bookmark
- Subscribe
- Mute
- Subscribe to RSS Feed
- Permalink
- Report Inappropriate Content
For QV you can make a calculated dimension combining the gender and the selected status like:
=Sex & ' ' & Selected
Then you'll need to play with the display properties and you can create something like this picture. Example QVW attached.
Thank you for letting me make a pie on the Thanksgiving holiday.
-Rob
http://www.easyqlik.com
http://masterssummit.com
http://qlikviewcookbook.com
- Mark as New
- Bookmark
- Subscribe
- Mute
- Subscribe to RSS Feed
- Permalink
- Report Inappropriate Content
Thanks Rwunderlich, I wasn't aware of that option of combining fields 🙂
I forgot to add in my original question, I need to display only one of all the possible Status, using "=only({<Status={'Job Offer'}>}(Gender&' '&Status))" as a calculated dimension, but I'm getting an "Error in calculated dimension" message. Any insight on this? Thanks!
- Mark as New
- Bookmark
- Subscribe
- Mute
- Subscribe to RSS Feed
- Permalink
- Report Inappropriate Content
You will need to wrap it in Aggr:
=Aggr(only({<Status={'Job Offer'}>}(Gender&' '&Status)), Gender, Status)
-Rob

