Unlock a world of possibilities! Login now and discover the exclusive benefits awaiting you.
- Qlik Community
- :
- All Forums
- :
- QlikView App Dev
- :
- Re: How to sum also a different dimension value th...
- Subscribe to RSS Feed
- Mark Topic as New
- Mark Topic as Read
- Float this Topic for Current User
- Bookmark
- Subscribe
- Mute
- Printer Friendly Page
- Mark as New
- Bookmark
- Subscribe
- Mute
- Subscribe to RSS Feed
- Permalink
- Report Inappropriate Content
How to sum also a different dimension value then listed Chart dimension values
Hi everyone,
I have been searching and trying suggestions from other discussions but I still have not the result I am looking for.
I have a Pivot Chart with 2 dimensions, Category (Category) and Month (Maand) which looks like this:
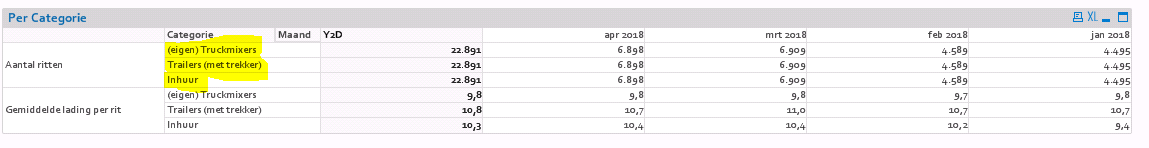
What I try to achieve is to calculate the percentage of each category being used against the total amount.
However I am not able to sum a not listed category in addition to the ones listed to be able to do this.
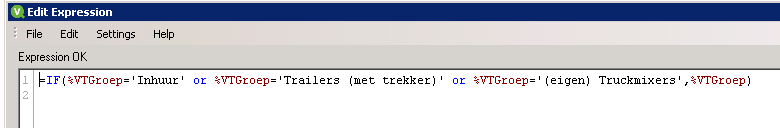
The Chart Category dimension is setup like this:
If I use the following expression, it gives per month dimension the total of the 3 listed Categories:
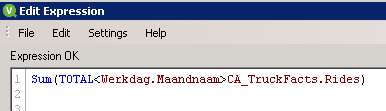
But how to get the "not listed" Category also in this ? (The not listed Category is "Overig (w.o. Mipo)"
Thank you.
- Tags:
- qlikview_scripting
Accepted Solutions
- Mark as New
- Bookmark
- Subscribe
- Mute
- Subscribe to RSS Feed
- Permalink
- Report Inappropriate Content
- Mark as New
- Bookmark
- Subscribe
- Mute
- Subscribe to RSS Feed
- Permalink
- Report Inappropriate Content
Try this
Aggr(NODISTINCT Sum(CA_TruckFacts.Rides), Werkdag.Maandnaam)
- Mark as New
- Bookmark
- Subscribe
- Mute
- Subscribe to RSS Feed
- Permalink
- Report Inappropriate Content
Hi Sunny,
Thanks for this, works like a charm!
Had to modify it like below to exclude the collected (instead of delivered) rows but with that added it does the trick:
Aggr(NODISTINCT Sum({<CA_TruckFacts.Trucknr={">0"}>}CA_TruckFacts.Rides), Werkdag.Maandnaam)
Have a good day!