Unlock a world of possibilities! Login now and discover the exclusive benefits awaiting you.
- Qlik Community
- :
- All Forums
- :
- QlikView App Dev
- :
- How to sum sales by year
- Subscribe to RSS Feed
- Mark Topic as New
- Mark Topic as Read
- Float this Topic for Current User
- Bookmark
- Subscribe
- Mute
- Printer Friendly Page
- Mark as New
- Bookmark
- Subscribe
- Mute
- Subscribe to RSS Feed
- Permalink
- Report Inappropriate Content
How to sum sales by year
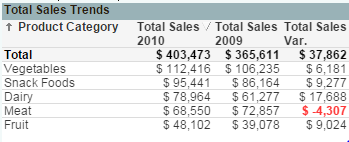
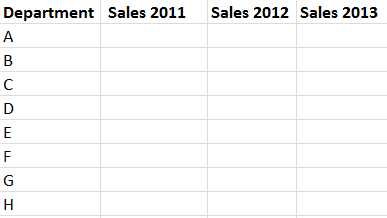
I am creating a straight table similar to the one below. and I want to pre-calculate sales by year for last 3 years. My fact table has transactional sales, one of the fields is date. what function do I use so that I get sum of sales for each year as a field.
Heade |
|---|
- « Previous Replies
-
- 1
- 2
- Next Replies »
Accepted Solutions
- Mark as New
- Bookmark
- Subscribe
- Mute
- Subscribe to RSS Feed
- Permalink
- Report Inappropriate Content
Load * Inline [
Dept,Year,Sales
A,2011,100
A,2012,200
A,2013,300
B,2011,100
B,2012,200
B,2013,300 ];
Dimension: Dept
Expr1: Sum({<Year={2011}>}Sales)
Expr2: Sum({<Year={2012}>}Sales)
Expr3: Sum({<Year={2013}>}Sales)

- Mark as New
- Bookmark
- Subscribe
- Mute
- Subscribe to RSS Feed
- Permalink
- Report Inappropriate Content
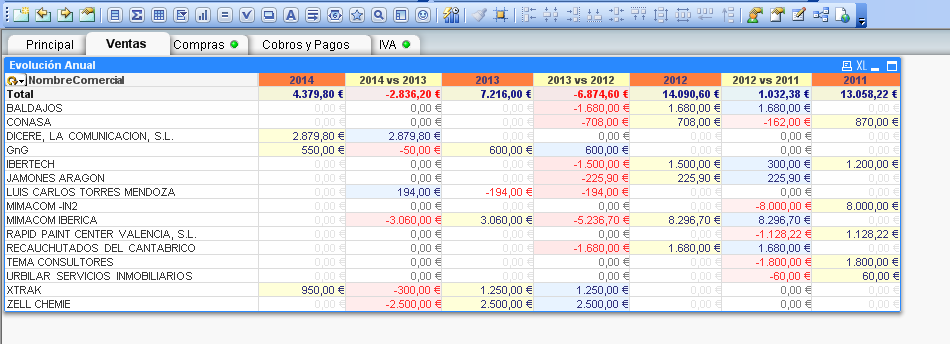
Is that you need?
- Mark as New
- Bookmark
- Subscribe
- Mute
- Subscribe to RSS Feed
- Permalink
- Report Inappropriate Content
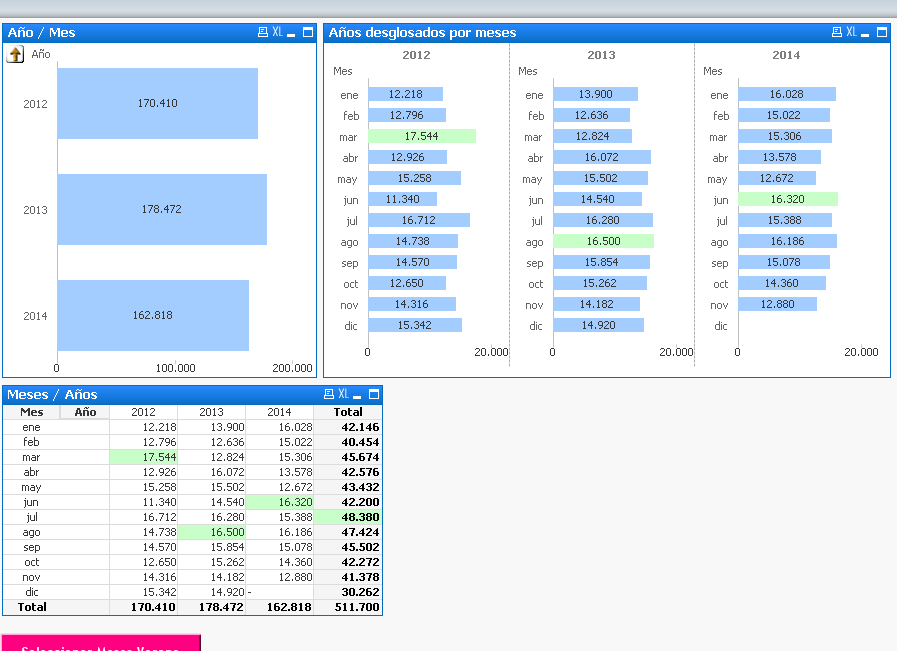
or this?
- Mark as New
- Bookmark
- Subscribe
- Mute
- Subscribe to RSS Feed
- Permalink
- Report Inappropriate Content
You may want to start dipping your feet into Set Analysis:
Here is the syntax if I am understanding correctly
Expression 1 = Sum({<Year={>=$(=Max(Year(DATEFIELD))}>}Sales)
Expression 2 = Sum({<Year={>=$(=Max(Year(DATEFIELD)-1)}>}Sales)
Expression 3 = Sum({<Year={>=$(=Max(Year(DATEFIELD)-2)}>}Sales)
- Mark as New
- Bookmark
- Subscribe
- Mute
- Subscribe to RSS Feed
- Permalink
- Report Inappropriate Content
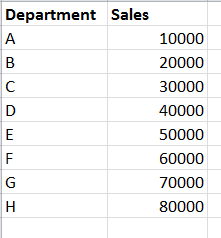
Thanks everyone. sorry it was not very clear what I was trying to explain. I am trying to create a straight table where I have probably 50 departments (which is my dimension, the image attached is just a sample). the transaction table has records for period between 2011 and 2013. If i do sum(Total Sales Receipts), it will lump the total sale from 2011 - 2013 in 1 column -- as in image 1 below. I want the sales for each department to be split in 3 diff years as in image below. So what should be my AGGR function, (i guess) to make that happen
- Mark as New
- Bookmark
- Subscribe
- Mute
- Subscribe to RSS Feed
- Permalink
- Report Inappropriate Content
Check this app
- Mark as New
- Bookmark
- Subscribe
- Mute
- Subscribe to RSS Feed
- Permalink
- Report Inappropriate Content
Anbu, where is the app
- Mark as New
- Bookmark
- Subscribe
- Mute
- Subscribe to RSS Feed
- Permalink
- Report Inappropriate Content
I am able to see the app. I am attaching again.
- Mark as New
- Bookmark
- Subscribe
- Mute
- Subscribe to RSS Feed
- Permalink
- Report Inappropriate Content
i can not open the qvw file. can you post the script here
- Mark as New
- Bookmark
- Subscribe
- Mute
- Subscribe to RSS Feed
- Permalink
- Report Inappropriate Content
An other way to solve it, is to use the aggr-Function. Create a Pivot-Table with the two Dimensions Dept. and Year. The Expression will be: aggr(Sum(sales), Year, Dept)
- « Previous Replies
-
- 1
- 2
- Next Replies »