Unlock a world of possibilities! Login now and discover the exclusive benefits awaiting you.
- Qlik Community
- :
- All Forums
- :
- QlikView App Dev
- :
- How to sum value for specific dimension
- Subscribe to RSS Feed
- Mark Topic as New
- Mark Topic as Read
- Float this Topic for Current User
- Bookmark
- Subscribe
- Mute
- Printer Friendly Page
- Mark as New
- Bookmark
- Subscribe
- Mute
- Subscribe to RSS Feed
- Permalink
- Report Inappropriate Content
How to sum value for specific dimension
Hi All,
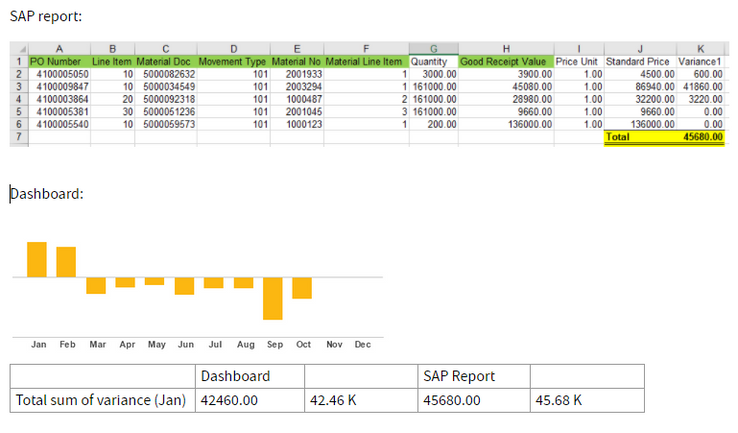
I want to get total sum of variance and show it as bar chart based on specific dimension values as below:
- PO number
- Line item
- Material Doc
- Material No.
- Material Line Item
- Good Receipt value
I even tried to calculate the total of variance in my bar chart using expression:
=Sum({$<Year{"$(=Max(Year))"}>}Variance1/1000)+Sum({1}0)
However, the variance in bar chart is not exactly same as my other report. When I checked my report, to get the variance it should be filter based on dimension as per I mentioned above.
If anyone has any ideas I would very much appreciate your help! Thank you.
- Mark as New
- Bookmark
- Subscribe
- Mute
- Subscribe to RSS Feed
- Permalink
- Report Inappropriate Content
pls supply more info so someone can help you. where does the Variance1 field come from? add sample data and what fields to compute variance from. and what the business rules are
- Mark as New
- Bookmark
- Subscribe
- Mute
- Subscribe to RSS Feed
- Permalink
- Report Inappropriate Content
Hi @edwin,
My apologize, maybe the way I explained is not clear. Actually, I pull the data from SAP database and created a data model in SAP Hana. Then, I do a connection to connect my data model in my QV. All the fields (dimensions) that I used is from SAP and calculation for variance1 field has been done in my data model.
In my dashboard, I've created a bar chart to display total sum of monthly variance but the variance figure is not same as my SAP report. After checking with my SAP report, I found that the variance for each row should be link to green highlighted color dimensions to get the correct total sum of variance (yellow highlighted color).
Example data for Jan:-
Question:
How can calculate total sum of variance based on dimensions? Because when I used the expression =Sum({$<Year{"$(=Max(Year))"}>}Variance1/1000)+Sum({1}0) , the total sum of variance was calculated not based on dimensions but it's only sum the Variance1 field.
Need your advice on this. I'm so sorry, I do not know the right way to explain it. Hope you will understand what I have explained it.
Thank you.
- Mark as New
- Bookmark
- Subscribe
- Mute
- Subscribe to RSS Feed
- Permalink
- Report Inappropriate Content
if i understand it correctly, Variance1 = Standard Price - Good Receipt Value * Price Unit
to understand where the issue is coming from, are you able to create the straight table with the fields in your example? is the field Good Receipt Value computed in your DM? are you able to get the correct Variance1 value per row? is your issue calculating Variace1? or are you getting it correctly but your SUM expression is not giving you the rt value? this will tell you if your issue is in your script or in your chart expression
