Unlock a world of possibilities! Login now and discover the exclusive benefits awaiting you.
- Qlik Community
- :
- All Forums
- :
- QlikView App Dev
- :
- Re: How to summarize the last non-null value(order...
- Subscribe to RSS Feed
- Mark Topic as New
- Mark Topic as Read
- Float this Topic for Current User
- Bookmark
- Subscribe
- Mute
- Printer Friendly Page
- Mark as New
- Bookmark
- Subscribe
- Mute
- Subscribe to RSS Feed
- Permalink
- Report Inappropriate Content
How to summarize the last non-null value(order by date) for each subject
Hi experts,
My data looks like this. What I want to do it to summarize the last non-null value (order by date) for each patient (PID) in order to see the percentage of patients who are obese. I tried to use aggr() firtsortedvalue, but no success. I think it can be done.
If the last BMI can be converted into different category(below) and shows in Bar chart, that will be great!!!
<=18.5 -Underweight
<=24.9 nornal weight
<=29.9 overweight
>30 Obese
Thank.
| PID | VID | VDATE | BMI |
| 1 | 1 | 8/1/2011 | 33.01 |
| 1 | 2 | 9/20/2011 | 31.64 |
| 1 | 3 | 3/15/2012 | 32.22 |
| 1 | 4 | 7/9/2012 | 32.81 |
| 1 | 5 | 7/12/2012 | |
| 1 | 6 | 8/30/2012 | |
| 2 | 13 | 1/13/2011 | 36.96 |
| 2 | 14 | 4/7/2011 | 38.93 |
| 2 | 15 | 5/4/2011 | 39.33 |
| 3 | 26 | 5/29/2014 | 25.35 |
| 4 | 27 | 5/27/2011 | |
| 5 | 28 | 3/24/2011 | 53.84 |
| 5 | 29 | 11/28/2011 | 53.84 |
| 5 | 30 | 3/20/2012 | |
| 5 | 31 | 3/28/2012 | 52.68 |
| 5 | 32 | 10/18/2012 | 53.84 |
| 5 | 33 | 1/28/2013 |
Accepted Solutions
- Mark as New
- Bookmark
- Subscribe
- Mute
- Subscribe to RSS Feed
- Permalink
- Report Inappropriate Content
Due to the security policy at my client, I cannot upload a qvw file, but if you follow these instructions, you dhould be fine. Use this script:
Classes:
LOAD * Inline
[
From, To, WClass
0, 18.59, Underweight
18.6, 24.99, Normal weight
25.0, 29.99, Overweight
30.0, 999, Obese
];
Source:
LOAD
PID,
VID,
Date(Date#(VDATE, 'M/d/yyyy')) As VDATE,
If(Len(T_BMI) = 0 And PID = Previous(PID), Peek(BMI), T_BMI) As BMI
;
LOAD * Inline
[
PID, VID, VDATE, T_BMI
1, 1, 8/1/2011, 33.01
1, 2, 9/20/2011, 31.64
1, 3, 3/15/2012, 32.22
1, 4, 7/9/2012, 32.81
1, 5, 7/12/2012,
1, 6, 8/30/2012,
2, 13, 1/13/2011, 36.96
2, 14, 4/7/2011, 38.93
2, 15, 5/4/2011, 39.33
3, 26, 5/29/2014, 25.35
4, 27, 5/27/2011,
5, 28, 3/24/2011, 53.84
5, 29, 11/28/2011, 53.84
5, 30, 3/20/2012,
5, 31, 3/28/2012, 52.68
5, 32, 10/18/2012, 53.84
5, 33, 1/28/2013,
];
Left Join (Source)
LOAD PID,
Max(VDATE) As VDATE,
1 As MaxFlag
Resident Source
Group By PID;
Left Join (Source)
IntervalMatch(BMI)
LOAD From, To
Resident Classes;
//--- Optional clean up
Left Join (Source)
LOAD *
Resident Classes;
DROP Table Classes;
DROP Fields From, To;
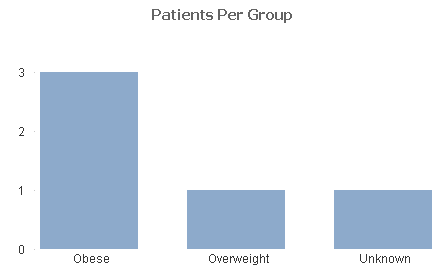
Now create a bar chart with
- calculated dimension: =If(Len(WClass) = 0, 'Unknown', WClass)
- expression: Count({<MaxFlag = {1}>} DISTINCT PID)
Results in tablebox:
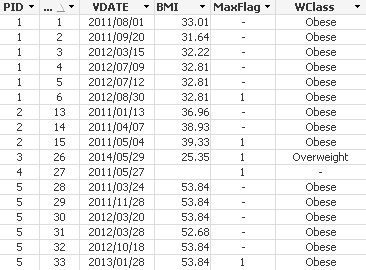
Chart
- Mark as New
- Bookmark
- Subscribe
- Mute
- Subscribe to RSS Feed
- Permalink
- Report Inappropriate Content
You want to create a bucket like this?
<=18.5 -Underweight
<=24.9 nornal weight
<=29.9 overweight
>30 Obese
Is it? or something else you want?
- Mark as New
- Bookmark
- Subscribe
- Mute
- Subscribe to RSS Feed
- Permalink
- Report Inappropriate Content
Due to the security policy at my client, I cannot upload a qvw file, but if you follow these instructions, you dhould be fine. Use this script:
Classes:
LOAD * Inline
[
From, To, WClass
0, 18.59, Underweight
18.6, 24.99, Normal weight
25.0, 29.99, Overweight
30.0, 999, Obese
];
Source:
LOAD
PID,
VID,
Date(Date#(VDATE, 'M/d/yyyy')) As VDATE,
If(Len(T_BMI) = 0 And PID = Previous(PID), Peek(BMI), T_BMI) As BMI
;
LOAD * Inline
[
PID, VID, VDATE, T_BMI
1, 1, 8/1/2011, 33.01
1, 2, 9/20/2011, 31.64
1, 3, 3/15/2012, 32.22
1, 4, 7/9/2012, 32.81
1, 5, 7/12/2012,
1, 6, 8/30/2012,
2, 13, 1/13/2011, 36.96
2, 14, 4/7/2011, 38.93
2, 15, 5/4/2011, 39.33
3, 26, 5/29/2014, 25.35
4, 27, 5/27/2011,
5, 28, 3/24/2011, 53.84
5, 29, 11/28/2011, 53.84
5, 30, 3/20/2012,
5, 31, 3/28/2012, 52.68
5, 32, 10/18/2012, 53.84
5, 33, 1/28/2013,
];
Left Join (Source)
LOAD PID,
Max(VDATE) As VDATE,
1 As MaxFlag
Resident Source
Group By PID;
Left Join (Source)
IntervalMatch(BMI)
LOAD From, To
Resident Classes;
//--- Optional clean up
Left Join (Source)
LOAD *
Resident Classes;
DROP Table Classes;
DROP Fields From, To;
Now create a bar chart with
- calculated dimension: =If(Len(WClass) = 0, 'Unknown', WClass)
- expression: Count({<MaxFlag = {1}>} DISTINCT PID)
Results in tablebox:
Chart
- Mark as New
- Bookmark
- Subscribe
- Mute
- Subscribe to RSS Feed
- Permalink
- Report Inappropriate Content
Hi,
I would consider just creating an If statement in your script.
eg: Load *,
if(BMI <=18.5, -Underweight
,if(BMI <=24.9 and >=18.5, nornal weight
. . . etc
)
) as WeightClass
resident table;
- Mark as New
- Bookmark
- Subscribe
- Mute
- Subscribe to RSS Feed
- Permalink
- Report Inappropriate Content
Thank you for your prompt helps. I copied your codes to my project, it works as expected. But I do have three questions,
1. My original data might not be ordered by the PID, and VDate, If the order is changed, I got different results.
2. I do not want to copy the BMI to next record if the BMI in next record is null, since I also need report the last non null BMI date.
3. Since my data has many other data fields, if the logic can move to chart level, it will be much better. I am not sure aggr(), firstsortedvalue and set analysis can do it.
Thanks
Longmatch
- Mark as New
- Bookmark
- Subscribe
- Mute
- Subscribe to RSS Feed
- Permalink
- Report Inappropriate Content
Yes. I want to create a pie or bar chart using this four categories, but I just want to use the last non null BMI (ordered by vdate.
- Mark as New
- Bookmark
- Subscribe
- Mute
- Subscribe to RSS Feed
- Permalink
- Report Inappropriate Content
Yes, but right now the problem is how to get the last no null BMI (order by vdate) at PID level. after that your logic can be used.