Unlock a world of possibilities! Login now and discover the exclusive benefits awaiting you.
- Qlik Community
- :
- All Forums
- :
- QlikView App Dev
- :
- How to take values from previous month
- Subscribe to RSS Feed
- Mark Topic as New
- Mark Topic as Read
- Float this Topic for Current User
- Bookmark
- Subscribe
- Mute
- Printer Friendly Page
- Mark as New
- Bookmark
- Subscribe
- Mute
- Subscribe to RSS Feed
- Permalink
- Report Inappropriate Content
How to take values from previous month
Hello
I'm trying to create a chart with opened cases, closed and remaining cases.
And I was only able to create something la this (see picture below) , but is not good.
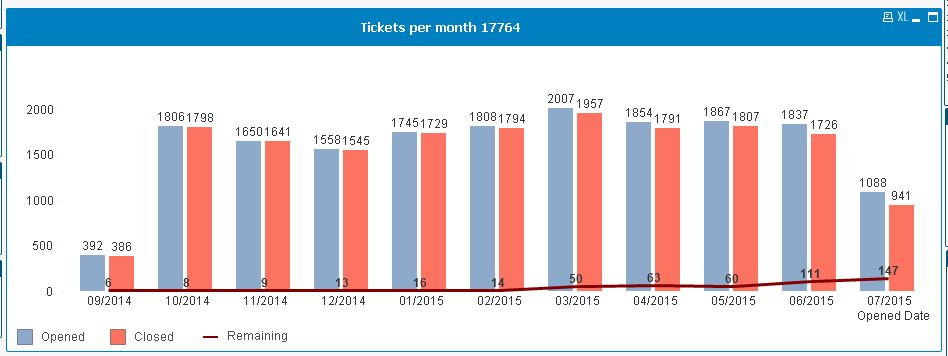
You can see now that the remaining cases is difference between 'Opened' and 'Closed', but I want to be different.
I want Remaining cases to take the cases that are still opened from previous month, in the current month. For example if I have 2 cases in 09/2014 which was closed in 10/2014, in 10/2014 I should have these 2 cases.
I have a 'formula' for the remaining cases, but I don't know how to take the values from the previous month.
remaining in month M = Remaining Month M-1 + Open cases on Month M – Closed Cases on Month M
Please keep in mind that Closed cases on Month M = Created Cases which has been closed during month M + Created Cases in previous month which has been closed in month M.
FYI : The closed cases are those which has 'closedMonth'.
Thanks!
- Mark as New
- Bookmark
- Subscribe
- Mute
- Subscribe to RSS Feed
- Permalink
- Report Inappropriate Content
If possible, post a small sample QVW, that makes it easier to understand your data model and create a solution.
In general, you can try enabling the full accumulation mode on expression tab for that remaining cases expression.
Or using rangesum(above()) to accumulate your values, maybe something like
=Rangesum(Above (FullExpressionToCalculateRemaining), 0, rowno() ))
Edit: Replace FullExpressionToCalculateRemaining with your expression to calculate the remaining cases.
- Mark as New
- Bookmark
- Subscribe
- Mute
- Subscribe to RSS Feed
- Permalink
- Report Inappropriate Content
Try this,
For the third expression go to Expression Tab under Accumulation select Accumulate and set value 1 for step back...This should work...