Unlock a world of possibilities! Login now and discover the exclusive benefits awaiting you.
- Qlik Community
- :
- All Forums
- :
- QlikView App Dev
- :
- Re: How to track records that have changes in some...
- Subscribe to RSS Feed
- Mark Topic as New
- Mark Topic as Read
- Float this Topic for Current User
- Bookmark
- Subscribe
- Mute
- Printer Friendly Page
- Mark as New
- Bookmark
- Subscribe
- Mute
- Subscribe to RSS Feed
- Permalink
- Report Inappropriate Content
How to track records that have changes in some columns.
Hi guys,
I have posted up this question b4. but no answer yet.
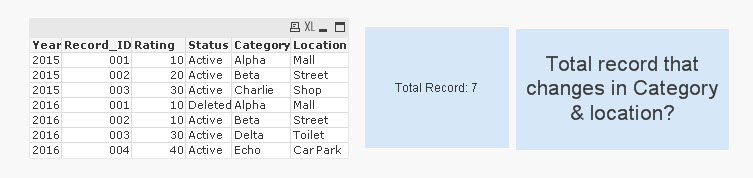
For example . i have 2 years of data loaded in. 2015-2016.
Take ID 003 as example: in year 2015, category column is charlie and locatin column is shop
in year 2016, ID 003, category changes to delta and location change to Toilet.
I need a text object to count all these ID that has changed. and a table box that show which ID has changes in category and location column.
- Tags:
- qlikview_scripting
- « Previous Replies
- Next Replies »
Accepted Solutions
- Mark as New
- Bookmark
- Subscribe
- Mute
- Subscribe to RSS Feed
- Permalink
- Report Inappropriate Content
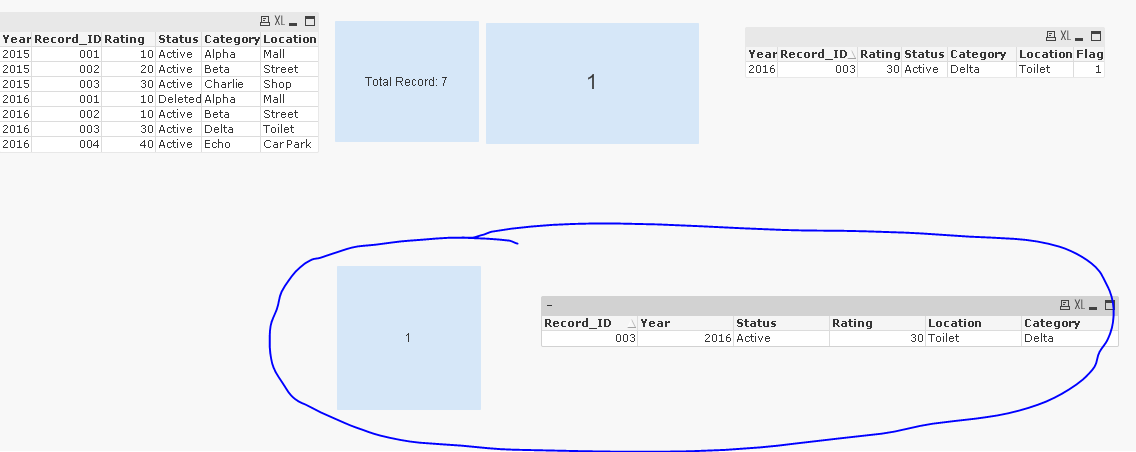
Front end solution
Text box expression:
=Count(DISTINCT {<Record_ID = {"=Count(DISTINCT Category&Location) > 1"}>} Record_ID)
Straight table (instead of table box)
Dimensions
Record_ID
Year
Status
Rating
Location
Category
Expression
=If(Year = 2016, Count(DISTINCT {<Record_ID = {"=Count(DISTINCT Category&Location) > 1"}>} Record_ID))
- Mark as New
- Bookmark
- Subscribe
- Mute
- Subscribe to RSS Feed
- Permalink
- Report Inappropriate Content
do u have last update date for the records?
- Mark as New
- Bookmark
- Subscribe
- Mute
- Subscribe to RSS Feed
- Permalink
- Report Inappropriate Content
Hi there,
this is my exmaple.
rgds,
Jim
- Mark as New
- Bookmark
- Subscribe
- Mute
- Subscribe to RSS Feed
- Permalink
- Report Inappropriate Content
Do you have to have a textbox to display the number of records that have changed or can you just flag or list the changes in a straight table?
Check the attached.
Hopefully this helps you.
- Mark as New
- Bookmark
- Subscribe
- Mute
- Subscribe to RSS Feed
- Permalink
- Report Inappropriate Content
In my orignal data, there's one last update column. what should i do with that?
- Mark as New
- Bookmark
- Subscribe
- Mute
- Subscribe to RSS Feed
- Permalink
- Report Inappropriate Content
Hi Jim,
Try this one
- Mark as New
- Bookmark
- Subscribe
- Mute
- Subscribe to RSS Feed
- Permalink
- Report Inappropriate Content
Jim -
Didn't we already work on something similar to this in the past?
Best,
Sunny
- Mark as New
- Bookmark
- Subscribe
- Mute
- Subscribe to RSS Feed
- Permalink
- Report Inappropriate Content
no bro... i am waiting for you!!! come, lets back to the post. we left this one.
- Mark as New
- Bookmark
- Subscribe
- Mute
- Subscribe to RSS Feed
- Permalink
- Report Inappropriate Content
How many do you expect to see as the output?
- Mark as New
- Bookmark
- Subscribe
- Mute
- Subscribe to RSS Feed
- Permalink
- Report Inappropriate Content
1 text object to display the count.
1 table box object to display the record id that has changes in cloumns compare to previous year.
- « Previous Replies
- Next Replies »