Unlock a world of possibilities! Login now and discover the exclusive benefits awaiting you.
- Qlik Community
- :
- All Forums
- :
- QlikView App Dev
- :
- How to trend Current Sales vs Prev Sales, using da...
- Subscribe to RSS Feed
- Mark Topic as New
- Mark Topic as Read
- Float this Topic for Current User
- Bookmark
- Subscribe
- Mute
- Printer Friendly Page
- Mark as New
- Bookmark
- Subscribe
- Mute
- Subscribe to RSS Feed
- Permalink
- Report Inappropriate Content
How to trend Current Sales vs Prev Sales, using date as dimension?
Hi,
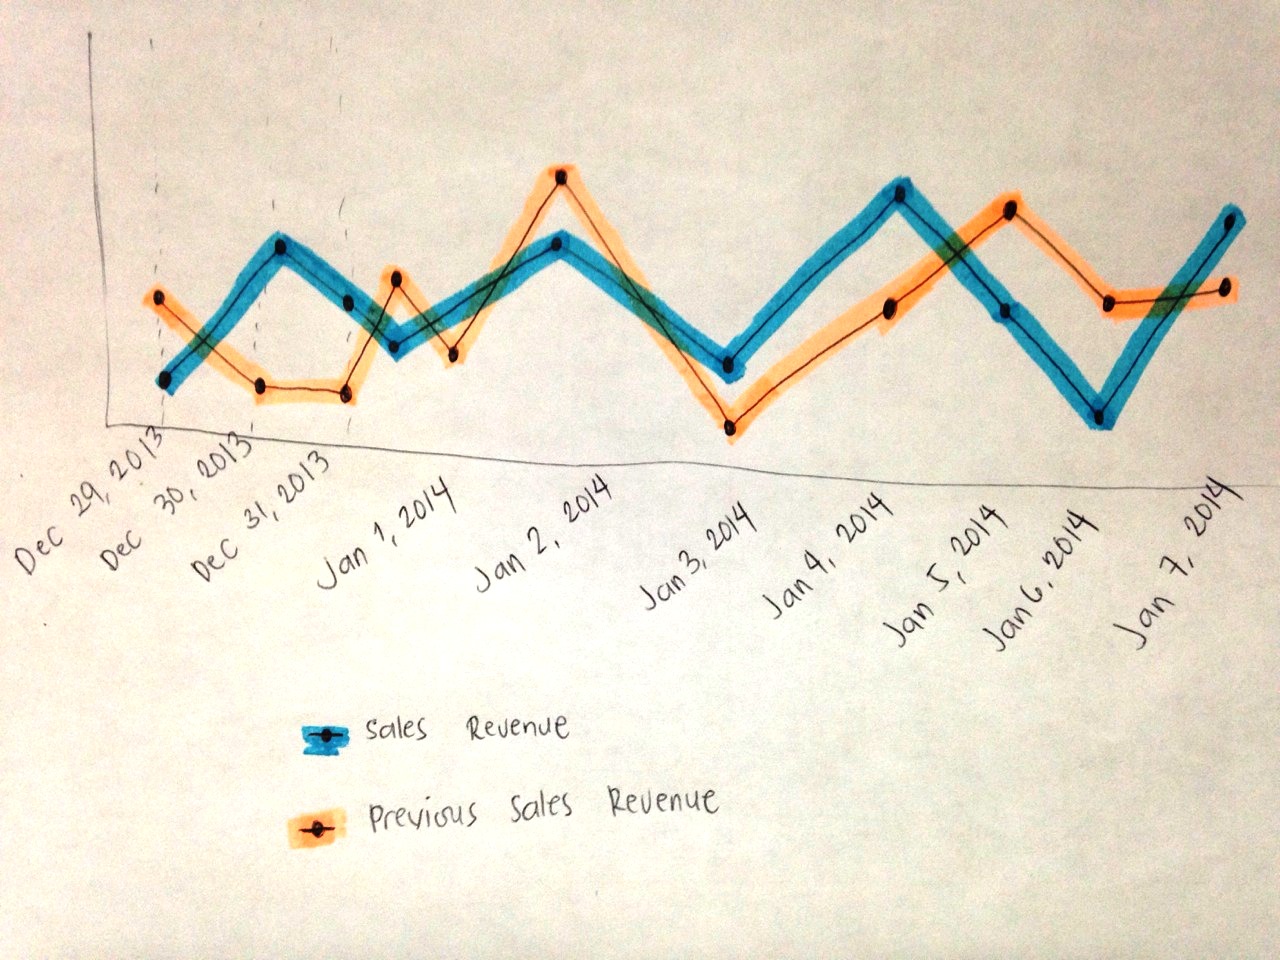
I have here one of client's requirement, would this be possible? Can we able to trend in one line chart the Current Sales vs Prev Sales, using Date as Dimension? (see attached file)

NOTE:
Blue Line Dates are Dec 29, 2013 to Jan 7, 2014
Orange Line Dates are Dec 29, 2012 to Jan 7, 2013
What did is that, only date of Blue Line being used as dimension. This the same as getting Sales Revenue of Same Day of Previous Year.
As far as I'm concern, this is not doable, isn't it? If anyone could help, I would appreciate.
Regards,
Bill
- « Previous Replies
-
- 1
- 2
- Next Replies »
- Mark as New
- Bookmark
- Subscribe
- Mute
- Subscribe to RSS Feed
- Permalink
- Report Inappropriate Content
Based upon those date requirements the lines would never intersect you have two distinct Years and a summary for each.
If the Yellow runs to December 2013 and the Blue runs from December 2013 how would they ever cross?
You would only be able to show Jan - Dec vs Jan to Dec of the relevant years (or Qtrs or which ever date period you select)
as attached - modified from Vikas
- Mark as New
- Bookmark
- Subscribe
- Mute
- Subscribe to RSS Feed
- Permalink
- Report Inappropriate Content
Hi, Bill Ringer Salalima
The question is, is it really doable?
I believe answer is yes. I would prefer to use for it AsOfTable approach as in article Calculating rolling n-period totals, averages or other aggregations mentioned by Gysbert Wassenaar in his answer.
I believe it gives results conforming to your requirements.

Look at example in attachment
- Mark as New
- Bookmark
- Subscribe
- Mute
- Subscribe to RSS Feed
- Permalink
- Report Inappropriate Content
Hello Vadim,
I already check the attached file, upon checking, I find it helpful. Will have to appy it first to the application and whenever it solves the problem, I will mark your answer as correct. Thank you so much!
Regards,
Bill
- Mark as New
- Bookmark
- Subscribe
- Mute
- Subscribe to RSS Feed
- Permalink
- Report Inappropriate Content
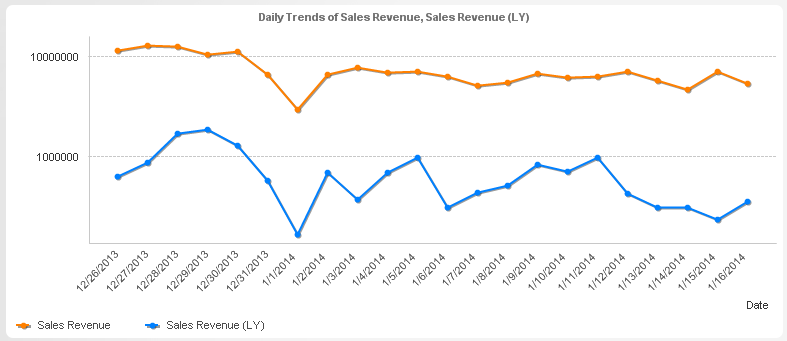
Thank you everyone for participating this ticket/discussion. Vadim Tsushko got the closest answer. I applied his idea, and add some tweakings, until I got the correct answer. (see attached)

- Mark as New
- Bookmark
- Subscribe
- Mute
- Subscribe to RSS Feed
- Permalink
- Report Inappropriate Content
Hi there,
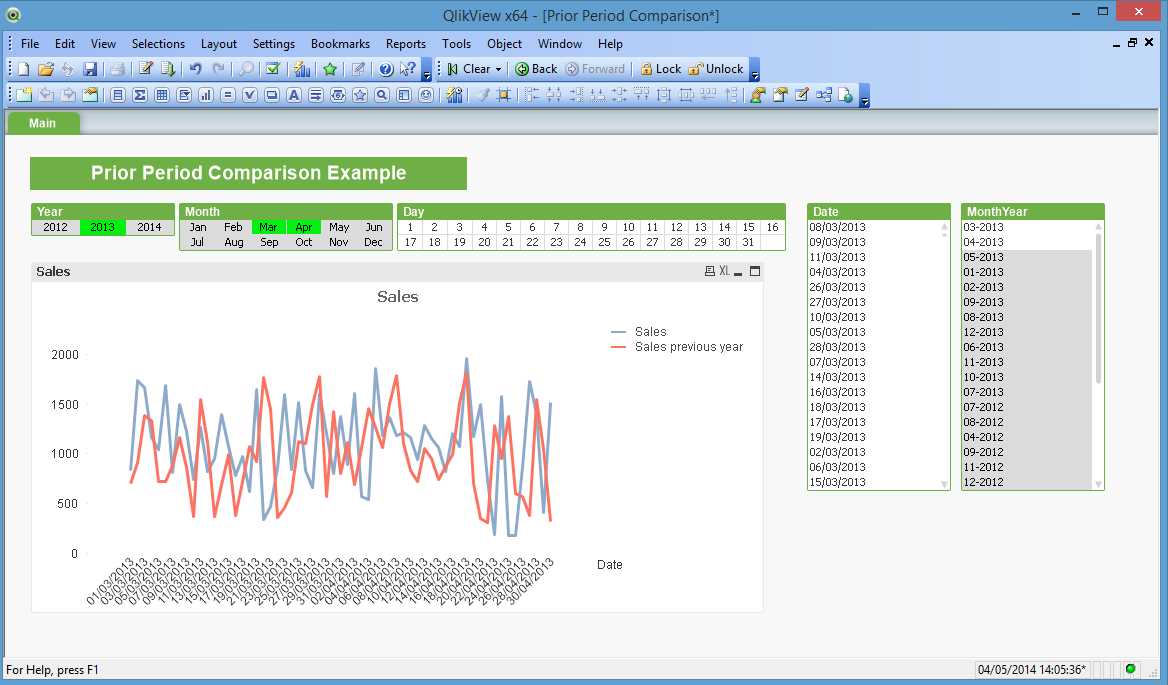
I produced a blog post outlining how you can accumulate values across dimensions using multiple joins to the data model and uploaded an QlikView document showing the code working:
QlikView App: Accumulate values in the Data Model
The blog post explains how to create an accumulated figure, a moving annual total and an average bar. The method used is similar to the one given here for prior periods.
Enjoy.
Steve
- Mark as New
- Bookmark
- Subscribe
- Mute
- Subscribe to RSS Feed
- Permalink
- Report Inappropriate Content
Hi Bill
Can you kindly share the application.
Regards
- Mark as New
- Bookmark
- Subscribe
- Mute
- Subscribe to RSS Feed
- Permalink
- Report Inappropriate Content
Yes sure, I will create a sample application related to the topic. Thanks for asking!
Regards,
Bill
- « Previous Replies
-
- 1
- 2
- Next Replies »