Unlock a world of possibilities! Login now and discover the exclusive benefits awaiting you.
- Qlik Community
- :
- All Forums
- :
- QlikView App Dev
- :
- How to use accumulative expression in Graphs and P...
- Subscribe to RSS Feed
- Mark Topic as New
- Mark Topic as Read
- Float this Topic for Current User
- Bookmark
- Subscribe
- Mute
- Printer Friendly Page
- Mark as New
- Bookmark
- Subscribe
- Mute
- Subscribe to RSS Feed
- Permalink
- Report Inappropriate Content
How to use accumulative expression in Graphs and Pivot ?
HI,
I am making a model of cash flow as the image below.
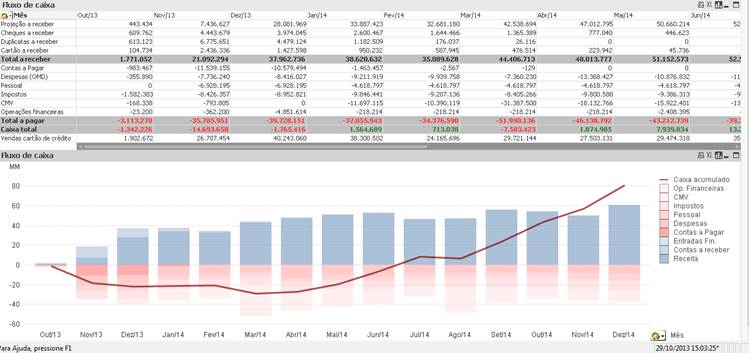
The line is the accumulative sum of all expenses and all revenues from Today() until the end of the next year.
I Have 1 problem:
- When I make a drill down on the graph the accumulative line initiates the calculation on the first date filtered.
How can I make an expression that calculates all the accumulative sum of my set analysis?
I would use this same expression to display the numbers on the pivot table.
Thanks in advance,
Tiago
- Mark as New
- Bookmark
- Subscribe
- Mute
- Subscribe to RSS Feed
- Permalink
- Report Inappropriate Content
Use set analysis on the expression that calculates the cumulative line. {1...<remainder of analysis and expression> will tell Qlikview to ignore user selections for that calculation.
- Mark as New
- Bookmark
- Subscribe
- Mute
- Subscribe to RSS Feed
- Permalink
- Report Inappropriate Content
Thanks Greg, but I already tried this.
If I use the "1" on the set analysis I will not be able to drill Down.
I want to drill down and keep the correct value.
- Mark as New
- Bookmark
- Subscribe
- Mute
- Subscribe to RSS Feed
- Permalink
- Report Inappropriate Content
If you are using the set analysis (use all dates) only on the trend line, you should still be able to drill down on the graph itself. Leave the rest of the calculations normal, to respond to filtering and drill-down. Only that calculation should be affected.
- Mark as New
- Bookmark
- Subscribe
- Mute
- Subscribe to RSS Feed
- Permalink
- Report Inappropriate Content
If I use all dates only in the line, when I drill down the line stands there.
I would like to show the line only on the selected dates.
And if I have this expression I can use on the table above the Graph too