Unlock a world of possibilities! Login now and discover the exclusive benefits awaiting you.
- Qlik Community
- :
- All Forums
- :
- QlikView App Dev
- :
- How to write expression using sum function in calc...
- Subscribe to RSS Feed
- Mark Topic as New
- Mark Topic as Read
- Float this Topic for Current User
- Bookmark
- Subscribe
- Mute
- Printer Friendly Page
- Mark as New
- Bookmark
- Subscribe
- Mute
- Subscribe to RSS Feed
- Permalink
- Report Inappropriate Content
How to write expression using sum function in calculated dimension.
Hello everyone,
I'm new to Qlik View.
I'd like to show "sum by project" in calculated dimension of the chart.

My current setting is as follows;
sum(total<project> amount)
But it doesn't work.
Does anyone help me ?
Haruko.S
- Tags:
- new_to_qlikview
- Mark as New
- Bookmark
- Subscribe
- Mute
- Subscribe to RSS Feed
- Permalink
- Report Inappropriate Content
I tried with sample data it is working. Instead of Straight table you can using pivot table also. Here i'm attaching sample qvw file please check it.
- Mark as New
- Bookmark
- Subscribe
- Mute
- Subscribe to RSS Feed
- Permalink
- Report Inappropriate Content
Hi,
Instead you can try using Pivot chart with sub total option for the project dimension(which you found under the presentation tab)?
Celambarasan
- Mark as New
- Bookmark
- Subscribe
- Mute
- Subscribe to RSS Feed
- Permalink
- Report Inappropriate Content
Thanx for the quick reply.
But it's a bit different what I really wanna do becuz of my explanation is bad.
Please see the below.
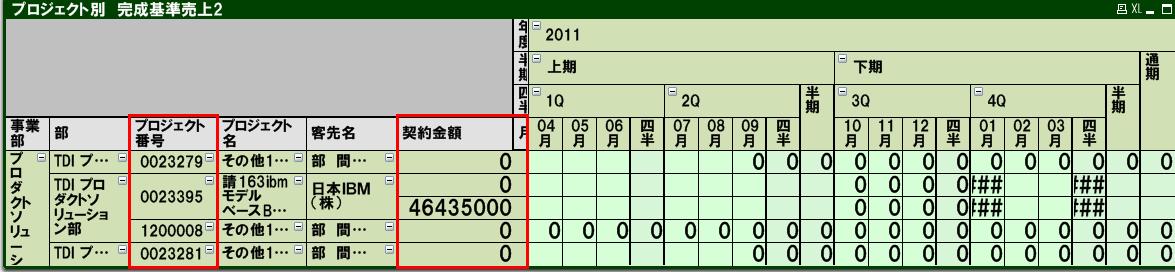
The 3rd column enclosed with red line is project.
The 6th column also enclosed with red line is amount.
Project #0023395 is liked to 2 orders because there are 2 rows.
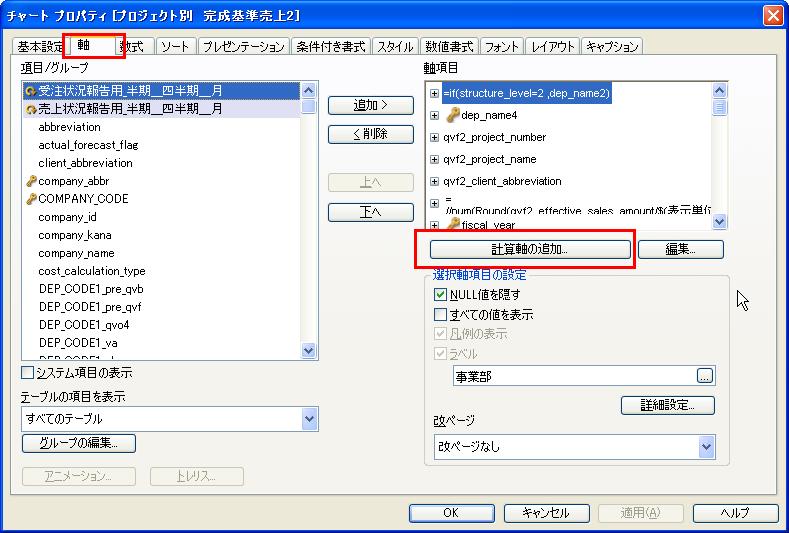
I'd like to merge those 2 rows into 1 row and show total amount by project there with setting some expression in dimension panel of the chart property dialog. (see the below)
- Mark as New
- Bookmark
- Subscribe
- Mute
- Subscribe to RSS Feed
- Permalink
- Report Inappropriate Content
i didn't get what u r saying..