Unlock a world of possibilities! Login now and discover the exclusive benefits awaiting you.
- Qlik Community
- :
- All Forums
- :
- QlikView App Dev
- :
- Re: I need to build this chart in QlikView
- Subscribe to RSS Feed
- Mark Topic as New
- Mark Topic as Read
- Float this Topic for Current User
- Bookmark
- Subscribe
- Mute
- Printer Friendly Page
- Mark as New
- Bookmark
- Subscribe
- Mute
- Subscribe to RSS Feed
- Permalink
- Report Inappropriate Content
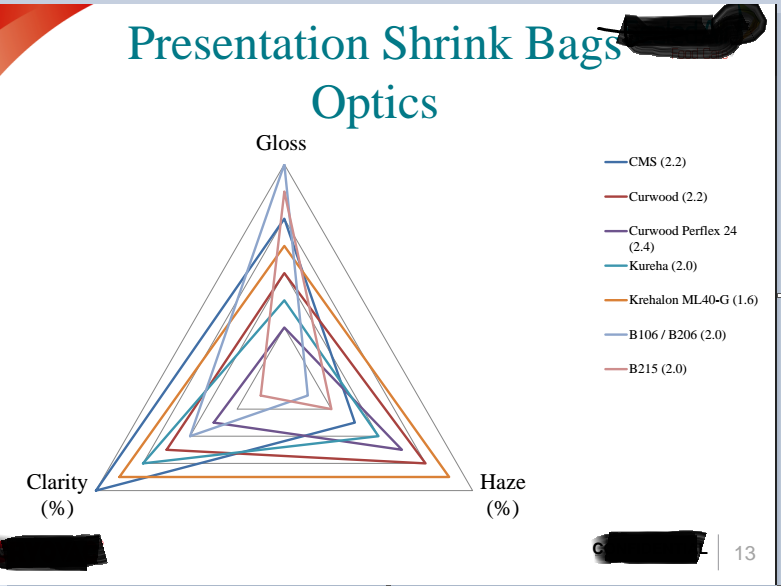
I need to build this chart in QlikView
Hi Team
As per business requirement I need to build this chart in Qlikview.Can you please suggest Hoe can i make this type of chart in Qlikview
Thanks in advance
- Tags:
- new_to_qlikview
- Mark as New
- Bookmark
- Subscribe
- Mute
- Subscribe to RSS Feed
- Permalink
- Report Inappropriate Content
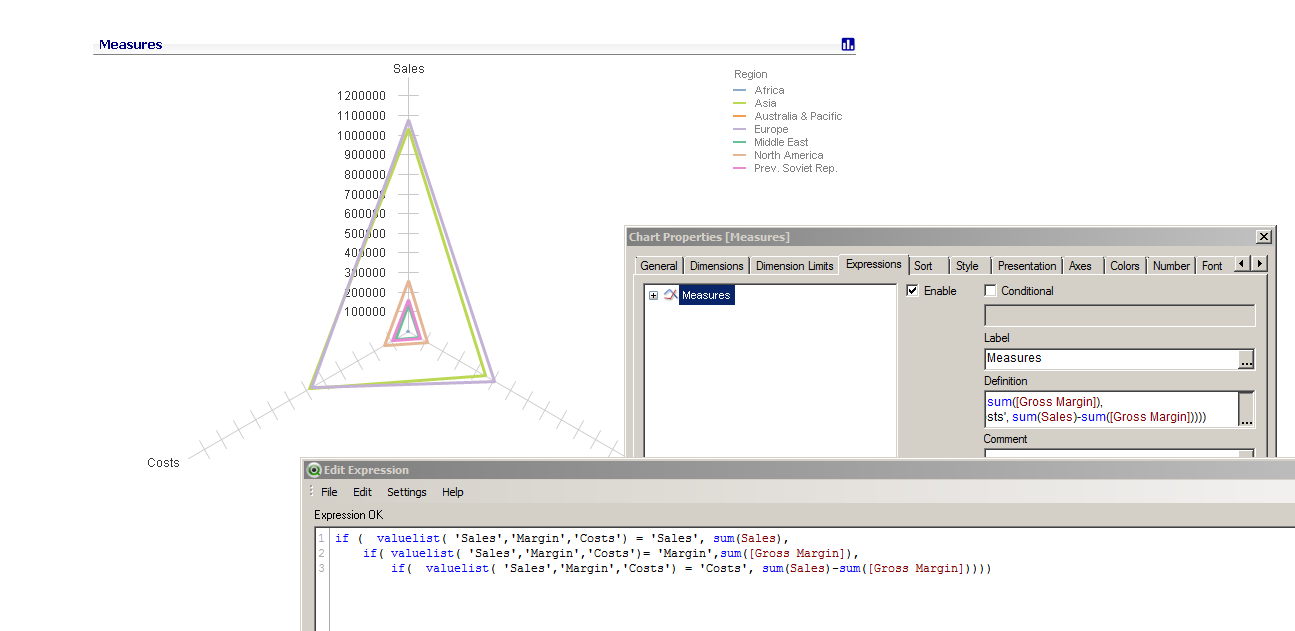
if all 3 measurements have the same axis you can do this with a synthetic dimension.
1. Create a radar chart
2. 1st dimension is valuelist('Gloss','Haze','Clarity')
3. 2nd dimension is the lines you show above
4. the measure is
if( valuelist('Gloss','Haze','Clarity') = 'Gloss', sum(Gloss) ,
if( valuelist('Gloss','Haze','Clarity') ='Haze', ...
if( valuelist('Gloss','Haze','Clarity') ='Clarity, ....
)))
Here is my example (with diff data)
- Mark as New
- Bookmark
- Subscribe
- Mute
- Subscribe to RSS Feed
- Permalink
- Report Inappropriate Content
maybe also possible:
Pick(Match(valuelist('Gloss','Haze','Clarity'), 'Gloss', 'Haze', 'Clarity'), sum(Gloss), sum(Haze), sum(Clarity))
hope this helps
regards
Marco
- Mark as New
- Bookmark
- Subscribe
- Mute
- Subscribe to RSS Feed
- Permalink
- Report Inappropriate Content
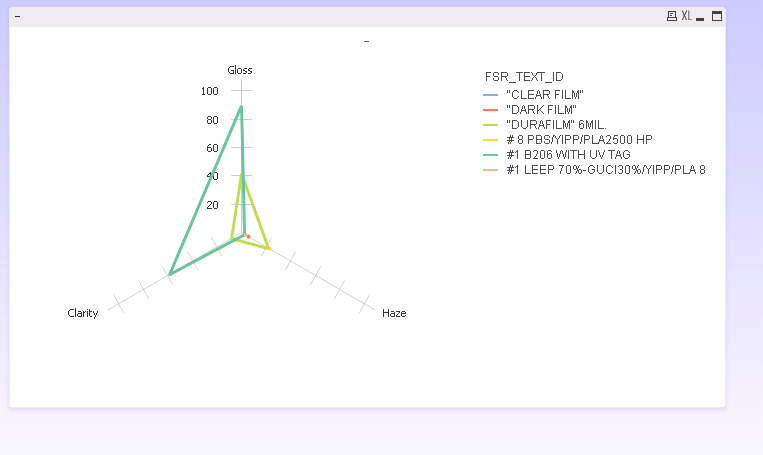
HI Poole
Thanks for your help. When I tried to implement I'm getting graph like this...But I need the triangle inside the triangle..can you please help me out
Thanks in advance
- Mark as New
- Bookmark
- Subscribe
- Mute
- Subscribe to RSS Feed
- Permalink
- Report Inappropriate Content
I do not understand this requirement: " I need the triangle inside the triangle" . Can you elaborate ?