Unlock a world of possibilities! Login now and discover the exclusive benefits awaiting you.
- Qlik Community
- :
- All Forums
- :
- QlikView App Dev
- :
- Re: I need to create a seamless Time Dimension, ba...
- Subscribe to RSS Feed
- Mark Topic as New
- Mark Topic as Read
- Float this Topic for Current User
- Bookmark
- Subscribe
- Mute
- Printer Friendly Page
- Mark as New
- Bookmark
- Subscribe
- Mute
- Subscribe to RSS Feed
- Permalink
- Report Inappropriate Content
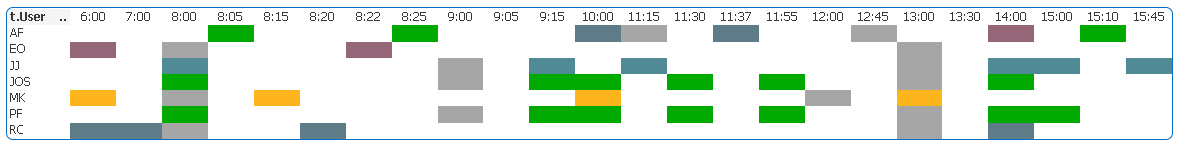
I need to create a seamless Time Dimension, based on Start Time
Hi All,
The above chart is a pivot table, The background color changes based on the task being performed
The times at the top are the start times of the task.
My question is how can I get a more seamless chart, basically I would like the chart to always have the 24 hours in a day but with the tasks colored where it fits in with the time of the day.
I hope that makes sense.
Regards
Alan
- « Previous Replies
-
- 1
- 2
- Next Replies »
- Mark as New
- Bookmark
- Subscribe
- Mute
- Subscribe to RSS Feed
- Permalink
- Report Inappropriate Content
Thanks Aunez,
I will try this and revert
Thanks again
Regards
Alan
- Mark as New
- Bookmark
- Subscribe
- Mute
- Subscribe to RSS Feed
- Permalink
- Report Inappropriate Content
Well,
try Henric's solution first. It is certainly more robust (I did not see he had answered). But you got the way to do it.
Fabrice
- Mark as New
- Bookmark
- Subscribe
- Mute
- Subscribe to RSS Feed
- Permalink
- Report Inappropriate Content
Hi Alan,
I'm recommending this article by just reading the subject line. And also read Henric's post:
http://community.qlik.com/blogs/qlikviewdesignblog/2013/02/12/reference-dates
and one more very useful post
http://iqlik.wordpress.com/2011/05/22/a-new-choice-of-armor-the-flag-matrix/
Thanks,
DV
- Mark as New
- Bookmark
- Subscribe
- Mute
- Subscribe to RSS Feed
- Permalink
- Report Inappropriate Content
Thanks Deepak
- « Previous Replies
-
- 1
- 2
- Next Replies »