Unlock a world of possibilities! Login now and discover the exclusive benefits awaiting you.
- Qlik Community
- :
- All Forums
- :
- QlikView App Dev
- :
- Re: I want to display the time in digital way in o...
- Subscribe to RSS Feed
- Mark Topic as New
- Mark Topic as Read
- Float this Topic for Current User
- Bookmark
- Subscribe
- Mute
- Printer Friendly Page
- Mark as New
- Bookmark
- Subscribe
- Mute
- Subscribe to RSS Feed
- Permalink
- Report Inappropriate Content
I want to display the time in digital way in one chart or in any other way
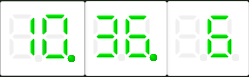
1(Hrs) 2(Min) 3(Sec)
the above is 3 gauge chart but I want display the total time(HH:MM:SS) in one chart instead of 3 charts or in any other way.
Anybody help me to get this.
- Mark as New
- Bookmark
- Subscribe
- Mute
- Subscribe to RSS Feed
- Permalink
- Report Inappropriate Content
HI
Use Text object instead of Digital Gauge Chart with white background, green color and increase the font size as your requirement, We refer the text object for this kind of scenario.
Please close the thread by marking correct answer & give likes if you like the post.
- Mark as New
- Bookmark
- Subscribe
- Mute
- Subscribe to RSS Feed
- Permalink
- Report Inappropriate Content
take a text box in general tab write the following function =Time(LocalTime()) in Font tab you can use option like bold,size , color etc in genral tab you can can change the backgound color to white so you have a digital clock in one object.
anant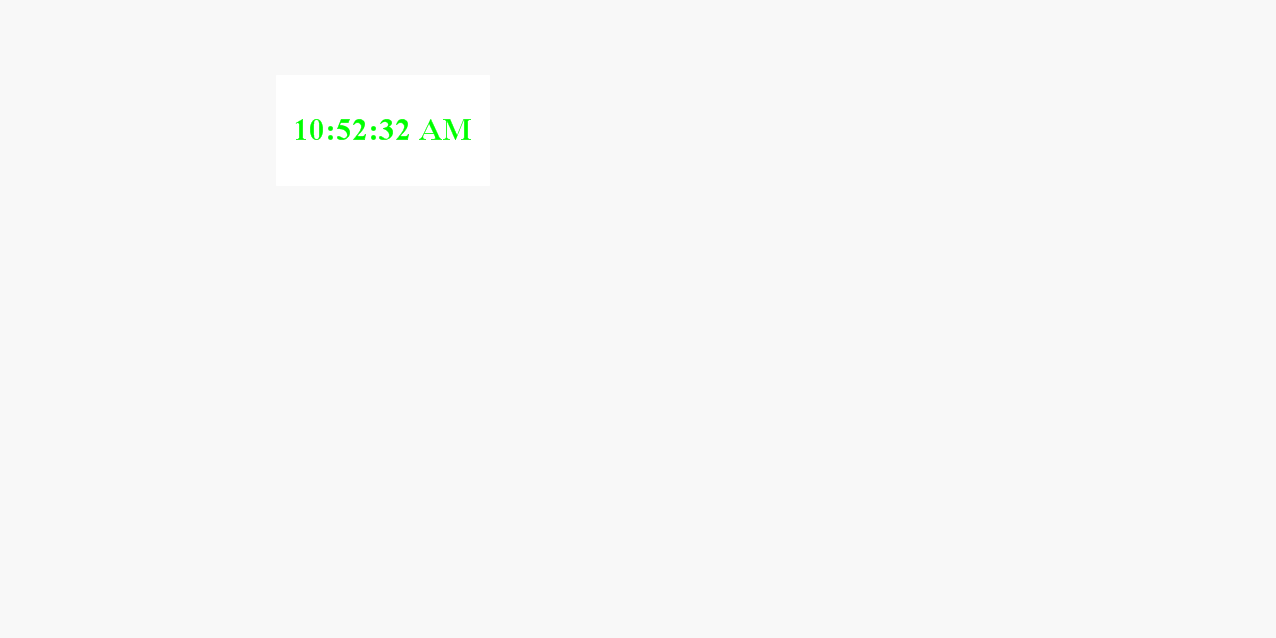
- Mark as New
- Bookmark
- Subscribe
- Mute
- Subscribe to RSS Feed
- Permalink
- Report Inappropriate Content
google a font called ds-digital, and use it on a text object displaying =time(now(2)) or the time you want to display.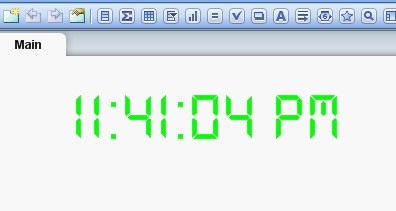
- Mark as New
- Bookmark
- Subscribe
- Mute
- Subscribe to RSS Feed
- Permalink
- Report Inappropriate Content
Hi Pratap,
PFA file for solution.
Regards,
Jagan.,
- Mark as New
- Bookmark
- Subscribe
- Mute
- Subscribe to RSS Feed
- Permalink
- Report Inappropriate Content
Thanks Jagan
- Mark as New
- Bookmark
- Subscribe
- Mute
- Subscribe to RSS Feed
- Permalink
- Report Inappropriate Content
Thanks Rama
- Mark as New
- Bookmark
- Subscribe
- Mute
- Subscribe to RSS Feed
- Permalink
- Report Inappropriate Content
thanks anant
- Mark as New
- Bookmark
- Subscribe
- Mute
- Subscribe to RSS Feed
- Permalink
- Report Inappropriate Content
Hi Pratap,
try either of these
=Timestamp(now(),'hh:mm:ss TT')
=Timestamp(LocalTime('GMT+05:30'),'hh:mm:ss TT')
Regards,
Vijay
- Mark as New
- Bookmark
- Subscribe
- Mute
- Subscribe to RSS Feed
- Permalink
- Report Inappropriate Content
Hi Jagan,
Time stamp should be in lower case(hh:mm:ss) otherwise it is taking MM as month number.
Regards,
Vijay