Unlock a world of possibilities! Login now and discover the exclusive benefits awaiting you.
- Qlik Community
- :
- All Forums
- :
- QlikView App Dev
- :
- Ignoring a dimension value in an aggregated chart ...
- Subscribe to RSS Feed
- Mark Topic as New
- Mark Topic as Read
- Float this Topic for Current User
- Bookmark
- Subscribe
- Mute
- Printer Friendly Page
- Mark as New
- Bookmark
- Subscribe
- Mute
- Subscribe to RSS Feed
- Permalink
- Report Inappropriate Content
Ignoring a dimension value in an aggregated chart (akin to 'having' clause?)
To keep the explanation as simple as possible, I’ll describe it thus: I’m counting the number of times patients are admitted to a hospital.Hence:-
Dimension:
=aggr(sum({<set analysis in here>}AdmCounter),PatientID)
Expression:
count({<set analysis in here>}distinct PatientID)
And I get a very nice chart thankyou...
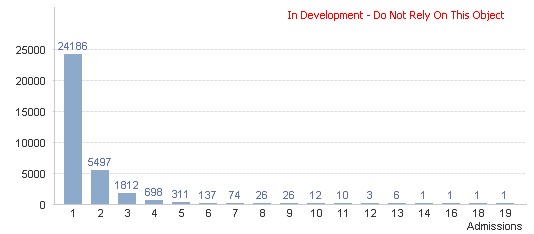
However, for this example, I’m really not interested in the “1” column but I want all the others (akin to a sql “Having Count >=2” clause I guess). How can the “1” column be ignored please? What do I write? Where do I put it? Any help very much appreciated.
- Mark as New
- Bookmark
- Subscribe
- Mute
- Subscribe to RSS Feed
- Permalink
- Report Inappropriate Content
Either try:
=aggr(if(sum({<set analysis in here>}AdmCounter)>1,
sum({<set analysis in here>}AdmCounter))
,PatientID)
or
if(sum({<set analysis in here>}AdmCounter)>1,
count({<set analysis in here>}distinct PatientID) )
Hope this helps,
Stefan
- Mark as New
- Bookmark
- Subscribe
- Mute
- Subscribe to RSS Feed
- Permalink
- Report Inappropriate Content
Thanks Stefan. The first of the two suggestions appears to be the correct solution and works just fine:
=aggr(if(sum({<set analysis in here>}AdmCounter)>1,
sum({<set analysis in here>}AdmCounter))
,PatientID)
Many thanks.
Graham