Unlock a world of possibilities! Login now and discover the exclusive benefits awaiting you.
- Qlik Community
- :
- All Forums
- :
- QlikView App Dev
- :
- Re: Image is not showing with value
- Subscribe to RSS Feed
- Mark Topic as New
- Mark Topic as Read
- Float this Topic for Current User
- Bookmark
- Subscribe
- Mute
- Printer Friendly Page
- Mark as New
- Bookmark
- Subscribe
- Mute
- Subscribe to RSS Feed
- Permalink
- Report Inappropriate Content
Image is not showing with value
Hello everyone,
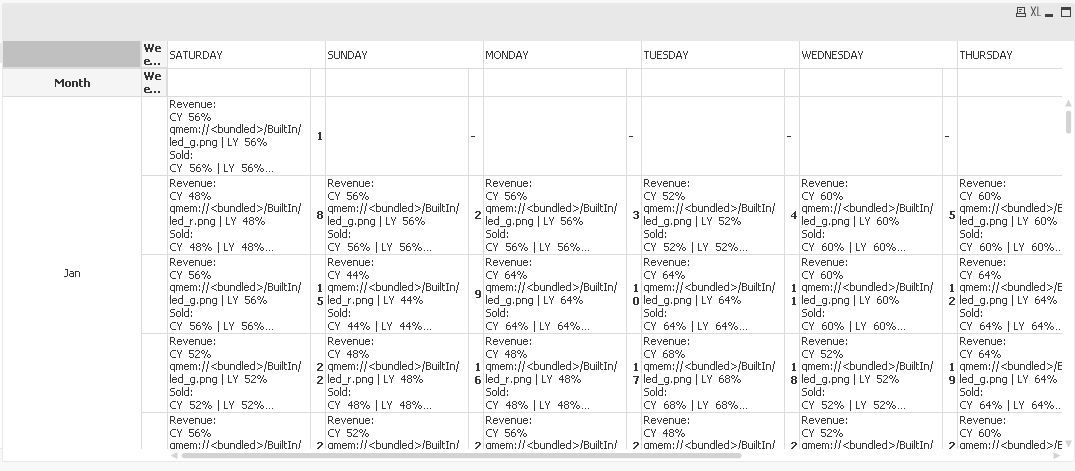
I created this by using pivot table, i wanted to show green arrow when CY>50% i applied a condition but it is showing the text,
Can any body please help me how to show the image with value
Thanks
- Tags:
- qlikview
- Mark as New
- Bookmark
- Subscribe
- Mute
- Subscribe to RSS Feed
- Permalink
- Report Inappropriate Content
The expression can be displayed either as text or as image, not both. If you do need both then you need to use two expressions.
talk is cheap, supply exceeds demand
- Mark as New
- Bookmark
- Subscribe
- Mute
- Subscribe to RSS Feed
- Permalink
- Report Inappropriate Content
Hi There
Create two columns one with the text and the other with the image
- Mark as New
- Bookmark
- Subscribe
- Mute
- Subscribe to RSS Feed
- Permalink
- Report Inappropriate Content
Hello Gysbert,
Thanks for the reply,
I am showing so many values in the single expression only,
Please check my expression below:
=IF(DAY(DATE)>0, if(secondarydimensionality(),
'Revenue:'
&chr(10)&
'CY' & ' '&(Sum(Revenue))&'%'&if((Sum(Revenue))>50,'gmem://<bundled>/BuiltIn/led_g.png','qmem://<bundled>/BuiltIn/led_r.png')&' | '&'LY' & ' '&(Sum(Revenue))&'%'
&chr(10)&
'Sold:'
&chr(10)&
'CY' & ' '&(Sum(Revenue))&'%' &' | '&'LY' & ' '&(Sum(Revenue))&'%'
&chr(10)&
'Growth:'
&chr(10)&
'CY' & ' '&(Sum(Revenue))&'%' &' | '&'LY' & ' '&(Sum(Revenue))&'%' )
,' ')
Thanks