Unlock a world of possibilities! Login now and discover the exclusive benefits awaiting you.
- Qlik Community
- :
- All Forums
- :
- QlikView App Dev
- :
- In Chart
- Subscribe to RSS Feed
- Mark Topic as New
- Mark Topic as Read
- Float this Topic for Current User
- Bookmark
- Subscribe
- Mute
- Printer Friendly Page
- Mark as New
- Bookmark
- Subscribe
- Mute
- Subscribe to RSS Feed
- Permalink
- Report Inappropriate Content
In Chart
Hi All,
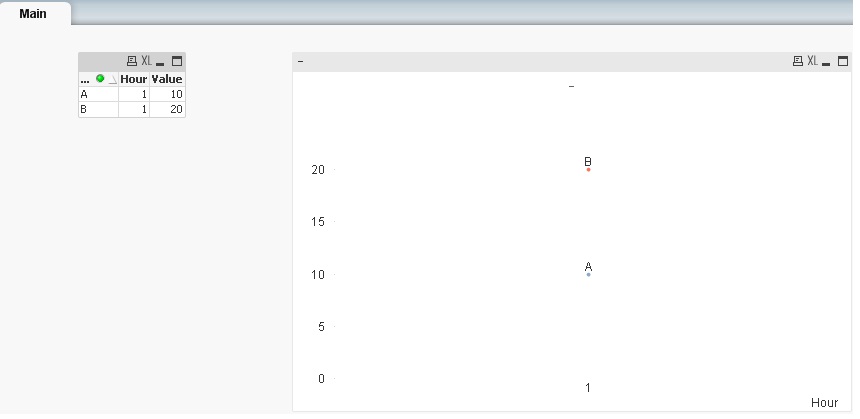
i have a chart in Hour, Day, Month, Year Trend for total logged Calls. can i show the agent name instead of the value who have logged more calls as per the dimension.
Please find the attached image for reference.
Regards,
Grace
- « Previous Replies
-
- 1
- 2
- Next Replies »
Accepted Solutions
- Mark as New
- Bookmark
- Subscribe
- Mute
- Subscribe to RSS Feed
- Permalink
- Report Inappropriate Content
Please try attached document.
You should also aggregate the count over the Assignee and Call date.
Hope the attached document helps.
Regards,
SK
- Mark as New
- Bookmark
- Subscribe
- Mute
- Subscribe to RSS Feed
- Permalink
- Report Inappropriate Content
Hi Grace
Can you please attach sample data file
Regards
Kushal Thakral
- Mark as New
- Bookmark
- Subscribe
- Mute
- Subscribe to RSS Feed
- Permalink
- Report Inappropriate Content
Yes you can.
Try using the dual function in the Expression that calculates the total logged calls. Prior to that you will have to build an expression which returns the name of the agent with the max calls by hour.
So your expression should look something like -
Dual(Agent_expression, Current_Expression).
- Mark as New
- Bookmark
- Subscribe
- Mute
- Subscribe to RSS Feed
- Permalink
- Report Inappropriate Content
Hi Grace
This is what you wanted in qlikview
- Mark as New
- Bookmark
- Subscribe
- Mute
- Subscribe to RSS Feed
- Permalink
- Report Inappropriate Content
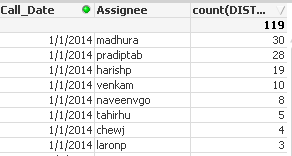
see for 1/1/2014 Madhura is topper and 2/1/2014 someother person... so i want the count and name of the topper person in chart...
- Mark as New
- Bookmark
- Subscribe
- Mute
- Subscribe to RSS Feed
- Permalink
- Report Inappropriate Content
how do i do this... plz help me
- Mark as New
- Bookmark
- Subscribe
- Mute
- Subscribe to RSS Feed
- Permalink
- Report Inappropriate Content
Hi,
Add one more expression
=FirstSortedValue(Assignee, -Calls)
and Unselect Line in Expression tab and Select Values on Data Points option
Regards,
Jagan.
- Mark as New
- Bookmark
- Subscribe
- Mute
- Subscribe to RSS Feed
- Permalink
- Report Inappropriate Content
FirstSortedValue(Assignee,count(DISTINCT {$<Link_Flag={'Arrival'}>} TicketID))
its giving null values...
- Mark as New
- Bookmark
- Subscribe
- Mute
- Subscribe to RSS Feed
- Permalink
- Report Inappropriate Content
Please try attached document.
You should also aggregate the count over the Assignee and Call date.
Hope the attached document helps.
Regards,
SK
- Mark as New
- Bookmark
- Subscribe
- Mute
- Subscribe to RSS Feed
- Permalink
- Report Inappropriate Content
Hi,
FirstSortedValue(Assignee,-Aggr(Count({$<Link_Flag={'Arrival'}>} DISTINCT Call_Id),Assignee,Call_date))
Regards,
jagan.
- « Previous Replies
-
- 1
- 2
- Next Replies »