Unlock a world of possibilities! Login now and discover the exclusive benefits awaiting you.
Announcements
Save $650 on Qlik Connect, Dec 1 - 7, our lowest price of the year. Register with code CYBERWEEK: Register
- Qlik Community
- :
- All Forums
- :
- QlikView App Dev
- :
- Re: In which chart is better for displaying 20 pro...
Options
- Subscribe to RSS Feed
- Mark Topic as New
- Mark Topic as Read
- Float this Topic for Current User
- Bookmark
- Subscribe
- Mute
- Printer Friendly Page
Turn on suggestions
Auto-suggest helps you quickly narrow down your search results by suggesting possible matches as you type.
Showing results for
Not applicable
2014-07-26
09:51 PM
- Mark as New
- Bookmark
- Subscribe
- Mute
- Subscribe to RSS Feed
- Permalink
- Report Inappropriate Content
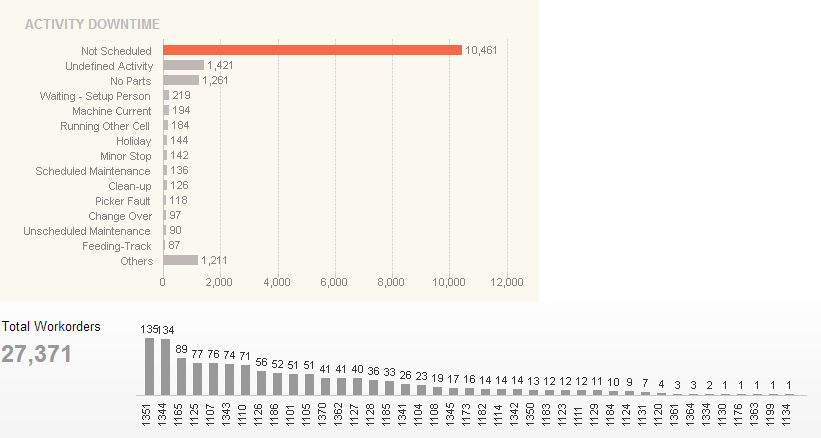
In which chart is better for displaying 20 products
In which chart is better for displaying 20 products
572 Views
4 Replies
Anonymous
Not applicable
2014-07-27
12:50 AM
Author
- Mark as New
- Bookmark
- Subscribe
- Mute
- Subscribe to RSS Feed
- Permalink
- Report Inappropriate Content
Hi swaroop,
If you are displaying totals bar charts are a good option.
For trends to evaluate how things perform across time trend lines might be a better option. But that's my opinion.
Regards,
Not applicable
2014-07-30
01:40 AM
Author
- Mark as New
- Bookmark
- Subscribe
- Mute
- Subscribe to RSS Feed
- Permalink
- Report Inappropriate Content
Thank You
467 Views
Contributor III
2014-07-30
02:07 AM
- Mark as New
- Bookmark
- Subscribe
- Mute
- Subscribe to RSS Feed
- Permalink
- Report Inappropriate Content
I would also go for Bar chart, for displaying Top 20 Products.
MVP
2014-07-30
02:08 AM
- Mark as New
- Bookmark
- Subscribe
- Mute
- Subscribe to RSS Feed
- Permalink
- Report Inappropriate Content
While installing Qlikview , Data Visualization qvw is available in following folder there you can get idea how to develop charts and
visualizaion ideas
C:\Program Files\QlikView\Examples\Documents
Hope this helps you
Vikas
Hope this resolve your issue.
If the issue is solved please mark the answer with Accept as Solution & like it.
If you want to go quickly, go alone. If you want to go far, go together.
If the issue is solved please mark the answer with Accept as Solution & like it.
If you want to go quickly, go alone. If you want to go far, go together.