Unlock a world of possibilities! Login now and discover the exclusive benefits awaiting you.
- Qlik Community
- :
- All Forums
- :
- QlikView App Dev
- :
- IntervalMatch Redux
- Subscribe to RSS Feed
- Mark Topic as New
- Mark Topic as Read
- Float this Topic for Current User
- Bookmark
- Subscribe
- Mute
- Printer Friendly Page
- Mark as New
- Bookmark
- Subscribe
- Mute
- Subscribe to RSS Feed
- Permalink
- Report Inappropriate Content
IntervalMatch Redux
Okay, I'm throwing in the towel...I am stumped and need help with IntervalMatch.
I have data records with start and end dates, and need to display each record in a time chart. Assume the current month is October 2015.
Say my data looks like below:
| ID | Start | End |
|---|---|---|
| 1 | 6/1/2015 | 8/8/2015 |
| 2 | 6/1/2015 | |
| 3 | 6/17/2015 | 6/24/2015 |
| 4 | 8/3/2015 | 9/16/2015 |
| 5 | 9/17/2015 |
I need a chart showing the months as dimension, then each ID showing in the months like this;
ID 1 shows in Jun, Jul, Aug
ID 2 shows in Jun, Jul, Aug, Sept, Oct
ID 3 shows in Jun
ID 4 shows in Aug, Sep
ID 5 shows in Sep, Oct
Charted as;
| Month | Count |
|---|---|
| June | 3 |
| July | 2 |
| August | 3 |
| September | 3 |
| October | 2 |
Thanks!
Accepted Solutions
- Mark as New
- Bookmark
- Subscribe
- Mute
- Subscribe to RSS Feed
- Permalink
- Report Inappropriate Content
Hi,
one solution could be:
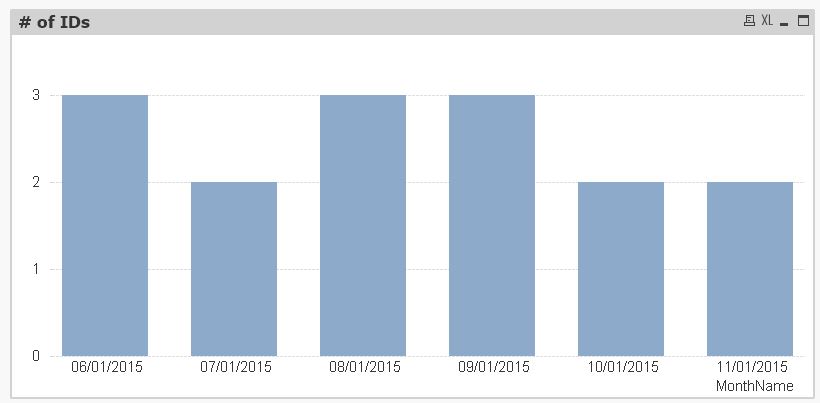
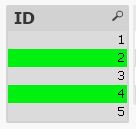
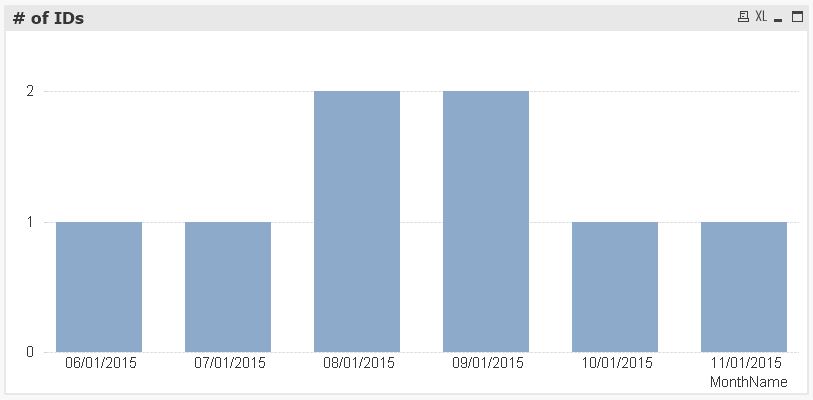
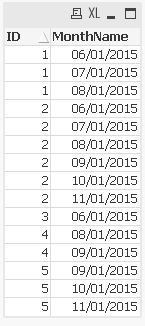
table1:
LOAD * FROM [https://community.qlik.com/thread/189799] (html, codepage is 1252, embedded labels, table is @1);

tabMonths:
LOAD ID,
    AddMonths(MonthName(Start),IterNo()-1) as MonthName
Resident table1
While MonthName(AddMonths(Start,IterNo()-1))<=Alt(End,Today());
hope this helps
regards
Marco
- Mark as New
- Bookmark
- Subscribe
- Mute
- Subscribe to RSS Feed
- Permalink
- Report Inappropriate Content
I wouldn't use IntervalMatch for this. I would create reference dates instead. See Creating Reference Dates for Intervals
When you have done that, you can create a standard Master Calendar for the reference dates and show the count per month.
HIC
- Mark as New
- Bookmark
- Subscribe
- Mute
- Subscribe to RSS Feed
- Permalink
- Report Inappropriate Content
Yes there is no need for IntervalMatch here. The "quick-and-dirty" approach would be:

- Mark as New
- Bookmark
- Subscribe
- Mute
- Subscribe to RSS Feed
- Permalink
- Report Inappropriate Content
My bad...you both replied with exactly what I asked for, but that wasn't what I need. I asked the wrong question.
What I need is a chart that shows, by month, which ID's are "open".
If I select ID 2 then the chart should show a count of 1 for June through October.
If I select ID 4 the chart shoukld show a count of 1 for August and September.
If I select ID's 2 and 4 I should see counts of 1, 1, 2, 2, 1 for June-October resp.
If I select none (Clear) I should see a count of 3 for June, 2 for July, 3 for August, 3 for September and 2 for October.
My apologies for not being clearer.
- Mark as New
- Bookmark
- Subscribe
- Mute
- Subscribe to RSS Feed
- Permalink
- Report Inappropriate Content
No, I think you asked the right question, because this is a data modelling problem.
If you create reference dates and a master calendar, like I suggest in my previous answer, you will have a data model with Month in the calendar table and ID in the original table. If you now create a bar chart with Month as dimension and Count(distinct ID) as measure/expression, you will get exactly what you describe.
HIC
- Mark as New
- Bookmark
- Subscribe
- Mute
- Subscribe to RSS Feed
- Permalink
- Report Inappropriate Content
Hi,
one solution could be:
table1:
LOAD * FROM [https://community.qlik.com/thread/189799] (html, codepage is 1252, embedded labels, table is @1);

tabMonths:
LOAD ID,
    AddMonths(MonthName(Start),IterNo()-1) as MonthName
Resident table1
While MonthName(AddMonths(Start,IterNo()-1))<=Alt(End,Today());
hope this helps
regards
Marco
- Mark as New
- Bookmark
- Subscribe
- Mute
- Subscribe to RSS Feed
- Permalink
- Report Inappropriate Content
Hi Marco,
Thanks for this simple yet elegant solution. With your solution came the addition of learning a new function (to me) of "ALT".
I added NoConcatenate to the resident load then dropped the initial table.
Thanks again,
John