Unlock a world of possibilities! Login now and discover the exclusive benefits awaiting you.
- Qlik Community
- :
- All Forums
- :
- QlikView App Dev
- :
- ¿IntervalMatch? to calculate an occupancy rate
- Subscribe to RSS Feed
- Mark Topic as New
- Mark Topic as Read
- Float this Topic for Current User
- Bookmark
- Subscribe
- Mute
- Printer Friendly Page
- Mark as New
- Bookmark
- Subscribe
- Mute
- Subscribe to RSS Feed
- Permalink
- Report Inappropriate Content
¿IntervalMatch? to calculate an occupancy rate
Hi
I have hundreds of records of a giant restaurant mining camp. Everytime somebody eats, a new record is generated.
Example:
25-01-2015 Name1 Location1 Food1
25-01-2015 Name2 Location2 Food1
25-01-2015 Name3 Location1 Food1
25-01-2015 Name4 Location1 Food1
25-01-2015 Name5 Location2 Food1
25-01-2015 Name6 Location1 Food1
....
And in another place, I have created a table with the capacity of each location:
15-07-2014 Location1 40
15-09-2014 Location1 65
15-12-2014 Location1 80
10-01-2014 Location2 30
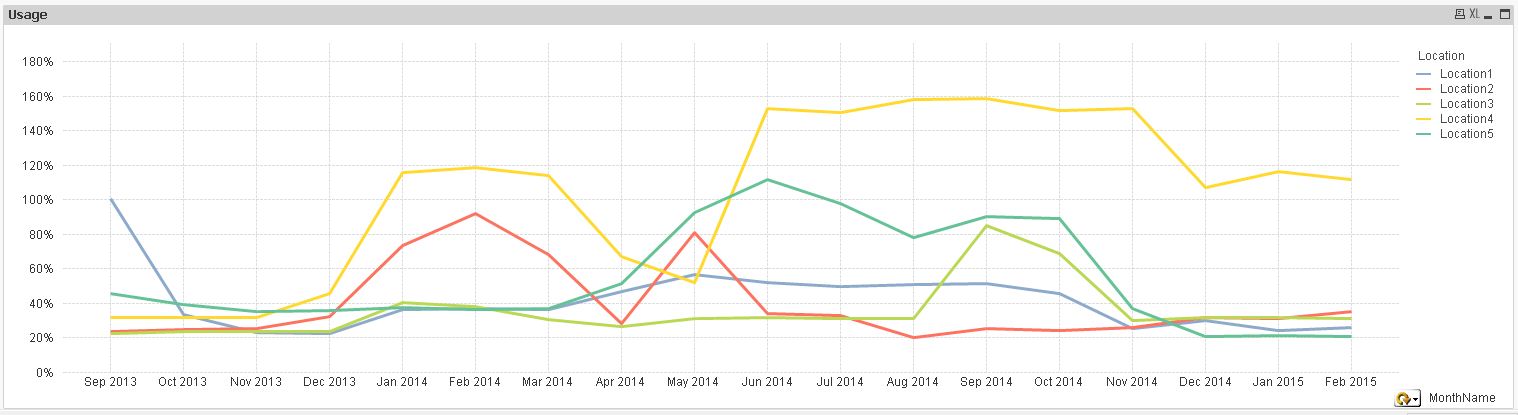
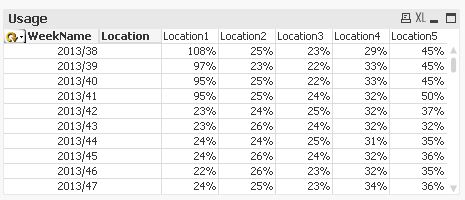
So what I need is to know how many times each restaurant has been used his full capacity by day, considering the capacities in each date range.
So if in 25-01-2015 there are 300 records, the restaurant has been used 300/80 = 3,75
So if in 25-09-2015 there are 300 records, the restaurant has been used 300/65 = 4,61
Can anybody help me please?
Thanks!!
- Mark as New
- Bookmark
- Subscribe
- Mute
- Subscribe to RSS Feed
- Permalink
- Report Inappropriate Content
So you wish to have the total customers per day/location measured against the varying capacity in certain periods?
Peter
- Mark as New
- Bookmark
- Subscribe
- Mute
- Subscribe to RSS Feed
- Permalink
- Report Inappropriate Content
Please see attached.
I have used Inline version but the same you will get using your data source:
T1:
LOAD * inline
[
Date,Name,Location,Food
25-01-2015, Name1, Location1, Food1
25-01-2015, Name2, Location2 , Food1
25-01-2015, Name3, Location1 , Food1
25-01-2015, Name4, Location1 , Food1
25-01-2015, Name5, Location2 ,Food1
25-01-2015, Name6 , Location1 ,Food1
25-01-2015, Name7, Location1, Food1
15-07-2015, Name8, Location1 , Food1
25-01-2015, Name9, Location1 , Food1
25-01-2015, Name10, Location1 , Food1
25-01-2015, Name11, Location2 ,Food1
25-01-2015, Name12 , Location1 ,Food1
];
T2:
LOAD * Inline
[
Date,Location,Capacity
15-07-2015, Location1, 4
15-09-2014, Location1, 6
25-01-2015, Location1, 8
10-01-2014, Location2, 3
]
- Mark as New
- Bookmark
- Subscribe
- Mute
- Subscribe to RSS Feed
- Permalink
- Report Inappropriate Content
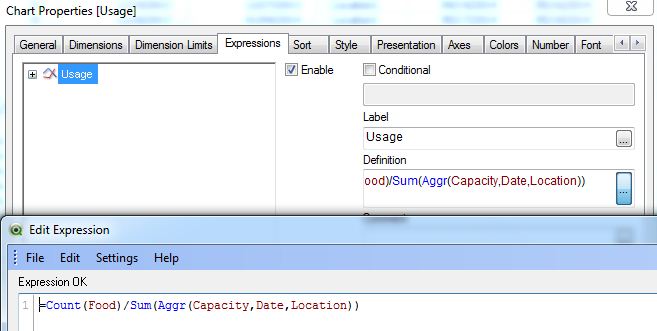
Try this example. This uses Interval Match to link the Capacity to the respective Date Range for each Location.
- Mark as New
- Bookmark
- Subscribe
- Mute
- Subscribe to RSS Feed
- Permalink
- Report Inappropriate Content
Yes Peter, That's what I want!
By the way.. as you write it, sounds a lot more than my text hehe
- Mark as New
- Bookmark
- Subscribe
- Mute
- Subscribe to RSS Feed
- Permalink
- Report Inappropriate Content
Hi,
one solution could be:
//test data generation
tabRestOrders:
LOAD Date(Today()-Ceil(Rand()*500)) as Date,
'Name'&Ceil(Rand()*5) as Name,
'Location'&Ceil(Rand()*5) as Location,
'Food'&Ceil(Rand()*5) as Food
AutoGenerate 100000;
tabCapacityTemp:
LOAD Date(Today()-Ceil(Rand()*500)) as CapacityDate,
'Location'&Ceil(Rand()*5) as Location,
Ceil(Rand()*91)+9 as Capacity
AutoGenerate 50;
LOAD Date(Today()-500) as CapacityDate,
'Location'&RecNo() as Location,
Ceil(Rand()*91)+9 as Capacity
AutoGenerate 5;
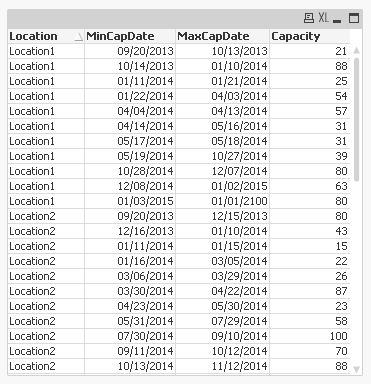
//interval generation
tabCapacity:
LOAD *,
AutoNumberHash128(MinCapDate, MaxCapDate) as CapIntervID;
LOAD Location,
Capacity,
CapacityDate as MinCapDate,
If(Location=Previous(Location),Date(Previous(CapacityDate)-1),MakeDate(2100)) as MaxCapDate
Resident tabCapacityTemp
Order By Location, CapacityDate desc;
DROP Table tabCapacityTemp;
//interval match
Left Join (tabRestOrders)
IntervalMatch(Date, Location)
LOAD MinCapDate, MaxCapDate, Location
Resident tabCapacity;
Left Join (tabRestOrders)
LOAD Distinct
MinCapDate,
MaxCapDate,
AutoNumberHash128(MinCapDate, MaxCapDate) as CapIntervID
Resident tabRestOrders;
DROP Fields MinCapDate, MaxCapDate From tabRestOrders;
//calendar
tabCalendar:
LOAD *,
Hour(Date) as Hour,
Day(Date) as Day,
WeekDay(Date) as WeekDay,
Week(Date) as Week,
WeekName(Date) as WeekName,
Month(Date) as Month,
MonthName(Date) as MonthName,
Dual('Q'&Ceil(Month(Date)/3),Ceil(Month(Date)/3)) as Quarter,
QuarterName(Date) as QuarterName,
Year(Date) as Year,
WeekYear(Date) as WeekYear;
LOAD Date(MinDate+IterNo()-1) as Date
While MinDate+IterNo()-1<=MaxDate;
LOAD Min(Date) as MinDate,
Max(Date) as MaxDate
Resident tabRestOrders;
hope this helps
regards
Marco