Unlock a world of possibilities! Login now and discover the exclusive benefits awaiting you.
- Qlik Community
- :
- All Forums
- :
- QlikView App Dev
- :
- IntervalMatch totals not quite correct
- Subscribe to RSS Feed
- Mark Topic as New
- Mark Topic as Read
- Float this Topic for Current User
- Bookmark
- Subscribe
- Mute
- Printer Friendly Page
- Mark as New
- Bookmark
- Subscribe
- Mute
- Subscribe to RSS Feed
- Permalink
- Report Inappropriate Content
IntervalMatch totals not quite correct
Hi
Our Quality Department is after a one page summary showing - for a selected
week (or month)
1) a daily running total of cases open - line
2) the number of cases opened each day - bar chart
3) the number of cases closed each day - bar chart
A large amount of data can be extracted from their database but to reduce
the data to a manageable number I have just used a simple Excel source attached
If you run the qvw - amending the source to pick up the Excel data file you will see the intervalmatch totals are not quite correct
As you can see from the chart attached the running total is not quite right
and I can't get all the 3 elements on the same chart
Help would be much appreciated
TabIncidents:
LOAD Case#,
[DateOpened],
[DateClosed]
FROM
[..\..\..\Data\QR038-Test.xlsx]
(ooxml, embedded labels, table is Sheet1);
LET varMaxDate = Num(Peek('DateOpened',-1,'TabIncidents'));
LET varMinDate = Num(Peek('DateOpened',0,'TabIncidents'));
TabCalendar:
LOAD Date(MinDate+IterNo()-1) as Date
While MinDate+IterNo() - 1 <= Today();
LOAD Min([DateOpened]) as MinDate
Resident TabIncidents;
TabLink:
IntervalMatch(Date)
LOAD [DateOpened],
[DateClosed]
Resident TabIncidents;
- Tags:
- new_to_qlikview
- Mark as New
- Bookmark
- Subscribe
- Mute
- Subscribe to RSS Feed
- Permalink
- Report Inappropriate Content
There are a couple of problems in your data model:
First, you load [DateClosed] as it is, which leads to problems when this is empty. Use
If(IsNum([DateClosed]), [DateClosed], Today()) as [DateClosed]
instead. This is the main problem. Fix this and most numbers will be correct.
Secondly, you have cases that has a [DateOpened] that lies in the future, after the upper date limit (Today()). These will of course not be counted.
Finally, you have a master calendar that is linked in a way that could cause problems:
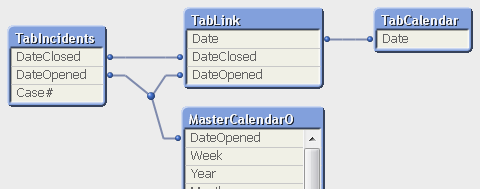
This leads to a synthetic key that could cause problems.
HIC
- Mark as New
- Bookmark
- Subscribe
- Mute
- Subscribe to RSS Feed
- Permalink
- Report Inappropriate Content
PFA
As Henric mentioned there are several errors in the data model (which I've corrected in the attached)