Unlock a world of possibilities! Login now and discover the exclusive benefits awaiting you.
- Qlik Community
- :
- All Forums
- :
- QlikView App Dev
- :
- Re: Is it possible to bold a heading?
- Subscribe to RSS Feed
- Mark Topic as New
- Mark Topic as Read
- Float this Topic for Current User
- Bookmark
- Subscribe
- Mute
- Printer Friendly Page
- Mark as New
- Bookmark
- Subscribe
- Mute
- Subscribe to RSS Feed
- Permalink
- Report Inappropriate Content
Is it possible to bold a heading?
Hi
I have done partial sums and now get the Totals and i am happy with this - but is it possible to highlight the total row and the total column?
Jo
| Date | Location | Total | loca | Locb | Locc | locd | loce |
| Total | 0.8% | 1.2% | 0.7% | 0.8% | 1.1% | 0.4% | |
| Apr 2015 | # | 1.5% | 3.2% | 0.8% | 1.2% | 2.0% | 0.4% |
| May 2015 | # | 1.9% | 0.4% | 0.6% | 1.3% | 4.5% | 0.9% |
| Jun 2015 | # | 2.5% | 3.0% | 1.4% | 3.0% | 2.5% | 1.2% |
| Jul 2015 | # | 2.5% | 1.6% | 4.2% | 2.2% | 2.2% | 2.8% |
| Aug 2015 | # | 3.2% | 11.4% | 0.7% | 2.0% | 3.4% | 0.1% |
| Sep 2015 | # | 1.4% | 1.7% | 1.7% | 1.6% | 1.7% | 0.1% |
| Oct 2015 | # | 1.5% | 0.6% | 2.0% | 1.6% | 2.0% | 0.7% |
| Nov 2015 | # | 0.6% | - | 0.6% | 0.8% | 0.7% | 0.2% |
Accepted Solutions
- Mark as New
- Bookmark
- Subscribe
- Mute
- Subscribe to RSS Feed
- Permalink
- Report Inappropriate Content
Hi Josephine,
Right click on the chart, there you will see custom format cell option. Give a try.
Let me know.
- Mark as New
- Bookmark
- Subscribe
- Mute
- Subscribe to RSS Feed
- Permalink
- Report Inappropriate Content
Hi Josephine,
Right click on the chart, there you will see custom format cell option. Give a try.
Let me know.
- Mark as New
- Bookmark
- Subscribe
- Mute
- Subscribe to RSS Feed
- Permalink
- Report Inappropriate Content
If in a chart, for each loca - loce column select the + symbol next to the expression and select Background Color. Enter the following formula in the Definition box:
=if(Dimensionality()=0,Red())
Where Red() can be any predefined color or RGB(x,x,x)
In the Total column enter:
=if(Dimensionality()=0,Red(),Yellow())
This will color the Total column yellow and the Total row red.
- Mark as New
- Bookmark
- Subscribe
- Mute
- Subscribe to RSS Feed
- Permalink
- Report Inappropriate Content
Hi,
Try like this
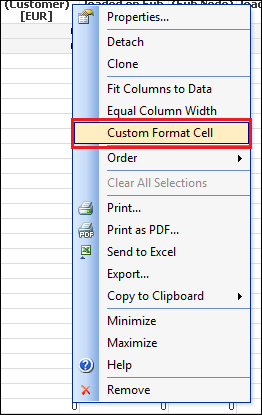
1. Press Ctrl + G to enable Design Grid option
2. Now right mouse click on the header and select Custom Format Cell option
3. Now apply the required font styles and give OK
HOpe this helps you.
Regards,
Jagan.
- Mark as New
- Bookmark
- Subscribe
- Mute
- Subscribe to RSS Feed
- Permalink
- Report Inappropriate Content
thank you - i tried and tried ... but it seems to be a very particular small area and then you get the properties for the cell.... But once I found it I could not see what the trouble was 
- Mark as New
- Bookmark
- Subscribe
- Mute
- Subscribe to RSS Feed
- Permalink
- Report Inappropriate Content
ah I now see why you need to do Control G (without Control G - you cannot even get to the particular small area and then get the properties showing the format of the cell!