Unlock a world of possibilities! Login now and discover the exclusive benefits awaiting you.
Announcements
Save $650 on Qlik Connect, Dec 1 - 7, our lowest price of the year. Register with code CYBERWEEK: Register
- Qlik Community
- :
- All Forums
- :
- QlikView App Dev
- :
- Is it possible to combine a table with a graph in ...
Options
- Subscribe to RSS Feed
- Mark Topic as New
- Mark Topic as Read
- Float this Topic for Current User
- Bookmark
- Subscribe
- Mute
- Printer Friendly Page
Turn on suggestions
Auto-suggest helps you quickly narrow down your search results by suggesting possible matches as you type.
Showing results for
Anonymous
Not applicable
2018-01-09
12:03 PM
- Mark as New
- Bookmark
- Subscribe
- Mute
- Subscribe to RSS Feed
- Permalink
- Report Inappropriate Content
Is it possible to combine a table with a graph in QlikView?
Dear QlikView community,
I was wondering if it were possible to create a table in QlikView that combines data and graph in one? Similar to the table below. If not, what would be an alternative? The goal is to give a quick visual of the data with an opportunity to see the descriptive stats and frequency/ percentage distributions.

Thank you in advance for your help!
1,413 Views
3 Replies
MVP
2018-01-09
12:11 PM
- Mark as New
- Bookmark
- Subscribe
- Mute
- Subscribe to RSS Feed
- Permalink
- Report Inappropriate Content
You can use so called mini charts in a straight table for this. There are sample files (e.g. 'What's new in QV 11.qvw') to demonstrate this or search the forum for mini charts.
edit: For example
Specialist III
2018-01-09
12:14 PM
- Mark as New
- Bookmark
- Subscribe
- Mute
- Subscribe to RSS Feed
- Permalink
- Report Inappropriate Content
Hi,
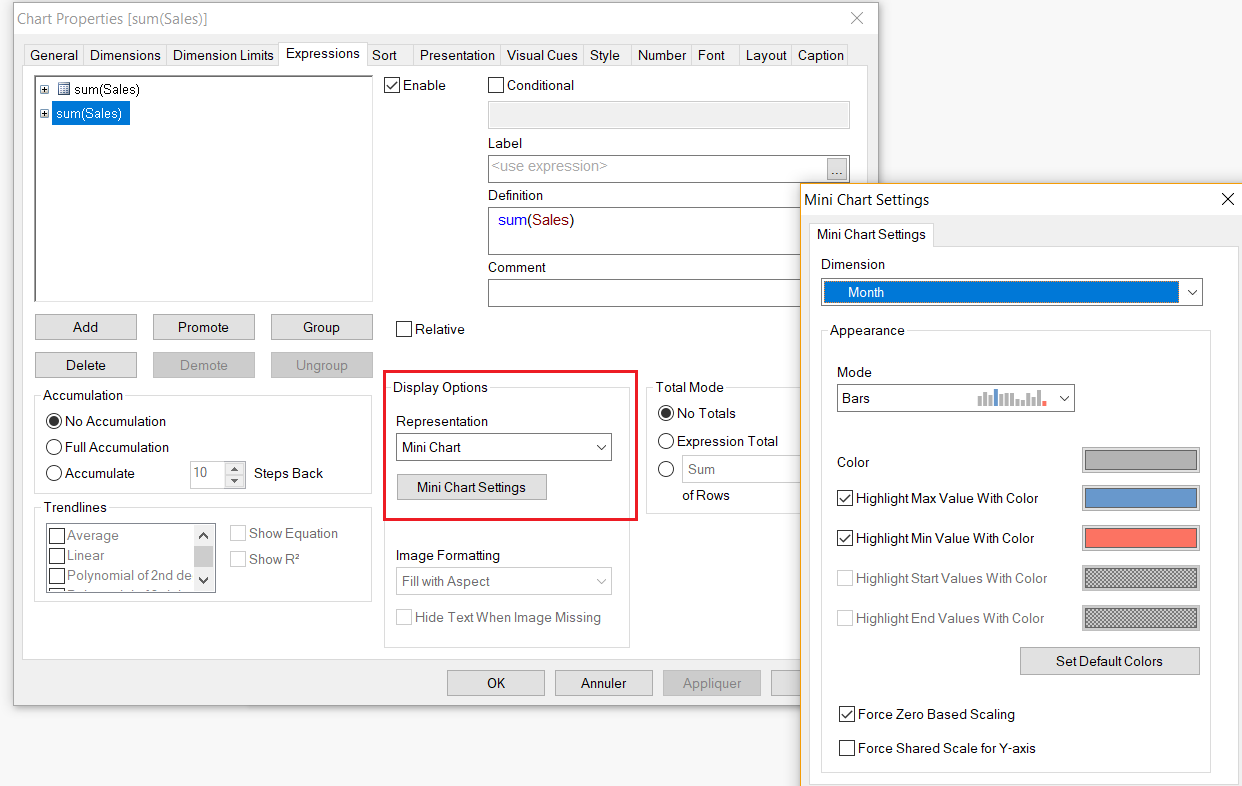
In a straight chart, you can use Mini chart :
Anonymous
Not applicable
2018-01-09
12:16 PM
Author
- Mark as New
- Bookmark
- Subscribe
- Mute
- Subscribe to RSS Feed
- Permalink
- Report Inappropriate Content
Great! Thank you very much for your help!
1,313 Views