Unlock a world of possibilities! Login now and discover the exclusive benefits awaiting you.
Announcements
Qlik Connect 2025: 3 days of full immersion in data, analytics, and AI. May 13-15 | Orlando, FL:
Learn More
- Qlik Community
- :
- All Forums
- :
- QlikView App Dev
- :
- Is there a possibility to give expressions as X-Ax...
Options
- Subscribe to RSS Feed
- Mark Topic as New
- Mark Topic as Read
- Float this Topic for Current User
- Bookmark
- Subscribe
- Mute
- Printer Friendly Page
Turn on suggestions
Auto-suggest helps you quickly narrow down your search results by suggesting possible matches as you type.
Showing results for
Anonymous
Not applicable
2015-05-12
01:40 AM
- Mark as New
- Bookmark
- Subscribe
- Mute
- Subscribe to RSS Feed
- Permalink
- Report Inappropriate Content
Is there a possibility to give expressions as X-Axis data in a Line Chart?
Suppose if I want to create a Line Chart, which has X-Axis values as X,Y,Z.
X,Y,Z are custom expressions like X=SUM(Sales1), Y=SUM(Sales2), Z=SUM(Sales3)
Is there a possibility to give expressions as axis data?
315 Views
2 Replies
MVP
2015-05-12
11:57 AM
- Mark as New
- Bookmark
- Subscribe
- Mute
- Subscribe to RSS Feed
- Permalink
- Report Inappropriate Content
Hi,
you can use the Aggr()-function in calculated dimensions to achieve this, e.g.:
=Aggr(Sum(Sales1), somedimensiontoaggregateover)
hope this helps
regards
Marco
MVP
2015-05-12
06:06 PM
- Mark as New
- Bookmark
- Subscribe
- Mute
- Subscribe to RSS Feed
- Permalink
- Report Inappropriate Content
Hi,
one example:
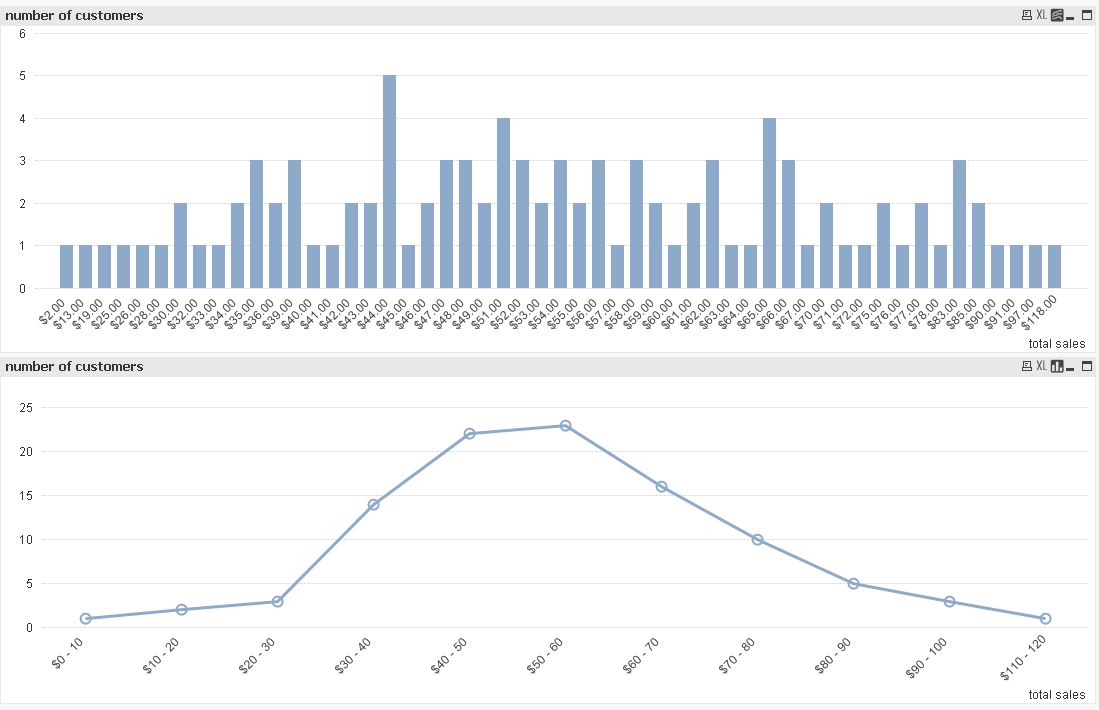
expression:
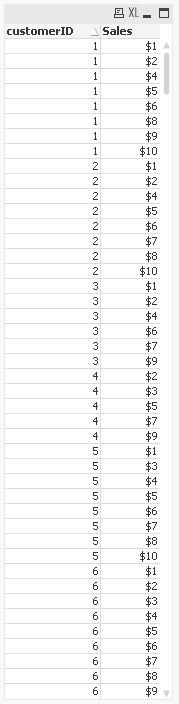
=Count(DISTINCT customerID)
calculated dimensions:
1st chart:
=Aggr(Sum(Sales), customerID)
2nd chart:
=Dual('$'&Replace(Class(Aggr(Sum(Sales), customerID),10),'<= x <','-'),Class(Aggr(Sum(Sales), customerID),10))
hope this helps
regards
Marco
239 Views