Unlock a world of possibilities! Login now and discover the exclusive benefits awaiting you.
- Qlik Community
- :
- All Forums
- :
- QlikView App Dev
- :
- Issue producing Table in the format required
- Subscribe to RSS Feed
- Mark Topic as New
- Mark Topic as Read
- Float this Topic for Current User
- Bookmark
- Subscribe
- Mute
- Printer Friendly Page
- Mark as New
- Bookmark
- Subscribe
- Mute
- Subscribe to RSS Feed
- Permalink
- Report Inappropriate Content
Issue producing Table in the format required
Hi,
This is my first post and hope I am not asking a stupid question here but I am having difficulty getting some data reported in the format I need.
I have a database which has a table of calls, which include the call type and date. I need a table showing totals by month for each call type (as shown below).
Type Apr May Jun Jul etc
A 12 3 0 5
B 0 6 17 3
etc..
I'm sure this must be pretty easy to do but have tried various charts, inc table and pivot table but have not been able to re-produce that format.
I am able to get the correct figures using a pivot table but not in the right format. I can get....
Type Month Total
A Apr 12
A May 3
A Jul 5
B May 6
B Jun 17
etc.
The months where there are zero calls for that type aren't shown in this format either.
If anybody can advise how I can achieve the format I need it would be much appreciated.
Thanks
Robin
- Mark as New
- Bookmark
- Subscribe
- Mute
- Subscribe to RSS Feed
- Permalink
- Report Inappropriate Content
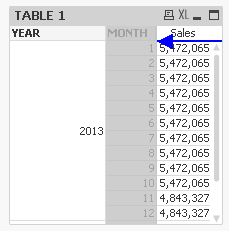
If you grab hold of the Month header in the pivot table, and drag it until you get a blue arrow like in the picture, you can create such a table with the Month as a horizontal dimension.
HIC

- Mark as New
- Bookmark
- Subscribe
- Mute
- Subscribe to RSS Feed
- Permalink
- Report Inappropriate Content
in dimension tab,
for month dimension
check suppress when value is null
check show allvalues
in presentation tab
uncheck suppress zero-values
- Mark as New
- Bookmark
- Subscribe
- Mute
- Subscribe to RSS Feed
- Permalink
- Report Inappropriate Content
Hi, thanks for replying.
The blue arrow only points vertically and not horizontally.
Robin
- Mark as New
- Bookmark
- Subscribe
- Mute
- Subscribe to RSS Feed
- Permalink
- Report Inappropriate Content
As suggested by Henric have you dragged the column name and moved the blue line to a column at right.
Or you can use
Straight table > Presentation > Horizontal (check this option)
- Mark as New
- Bookmark
- Subscribe
- Mute
- Subscribe to RSS Feed
- Permalink
- Report Inappropriate Content
Thanks, that seems to be it. I think I was using a Pivot table and it seems to need to be a straight table, and you then drag the column to the right and it goes to the horizontal axis. Thanks everyone.