Unlock a world of possibilities! Login now and discover the exclusive benefits awaiting you.
- Qlik Community
- :
- All Forums
- :
- QlikView App Dev
- :
- Re: Issue with Normal Distribution(Gaussian Distri...
- Subscribe to RSS Feed
- Mark Topic as New
- Mark Topic as Read
- Float this Topic for Current User
- Bookmark
- Subscribe
- Mute
- Printer Friendly Page
- Mark as New
- Bookmark
- Subscribe
- Mute
- Subscribe to RSS Feed
- Permalink
- Report Inappropriate Content
Issue with Normal Distribution(Gaussian Distribution)
Dear Community,
I had an issue with Normal Distribution Curve. My curve shows like below Image:
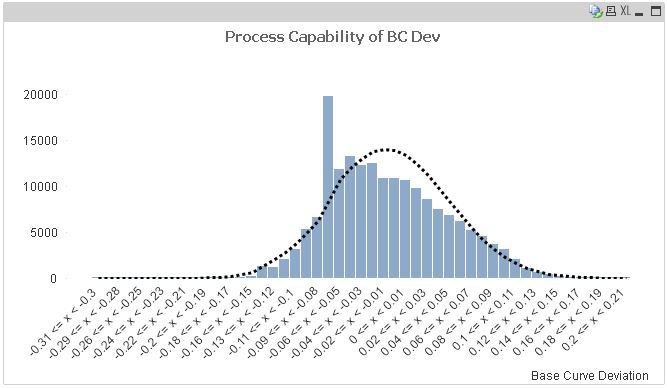
Here My Dimesnion is =if(BC_DEV<>' ', class(BC_DEV,0.01))
Expressions:
For Bars: =Count(DISTINCT LENS_MASTER_SEQUENCE)
For Bell Curve: =if(BC_DEV<>'',NORMDIST(Class(BC_DEV,'0.01'),avg({1}TOTAL BC_DEV),Stdev({1}TOTAL BC_DEV),0))*2000
In the above expression I am Multiplying the expression with 2000 to get the curve in bell shape, otherwise it is like a flat straighline on X-Axis. And also I do not want to make the expression static by multiplying with 2000 or any other number.
If I make any selections I am not getting the exact curve for those particular filters. Please find the image below:

I want the Normal Curve to be calculated for any selections.
Please help me in achieving this. Thanks a ton in advance.
Regards
Manideep
- « Previous Replies
-
- 1
- 2
- Next Replies »
- Mark as New
- Bookmark
- Subscribe
- Mute
- Subscribe to RSS Feed
- Permalink
- Report Inappropriate Content
Can anyone please???
- Mark as New
- Bookmark
- Subscribe
- Mute
- Subscribe to RSS Feed
- Permalink
- Report Inappropriate Content
To create the vertical reference lines, you will need to change the x-axis to continuous and then add vertical reference lines in Properties | Presentation tab.
To ensure that 0 is always shown, you can fix the Min, Max and Step values for the x-axis to -0.24, +0.24, 0.04 respectively.
- Mark as New
- Bookmark
- Subscribe
- Mute
- Subscribe to RSS Feed
- Permalink
- Report Inappropriate Content
Hi Jonathan Dienst.
I got the verical reference lines but the bars are seemed to be touching. when I use bar border width all the bars are overlapping. I tried with the axis static step but no luck. Could you please help me in getting this.
PFA
- « Previous Replies
-
- 1
- 2
- Next Replies »