Unlock a world of possibilities! Login now and discover the exclusive benefits awaiting you.
- Qlik Community
- :
- All Forums
- :
- QlikView App Dev
- :
- Re: Issues in Pareto Chart
- Subscribe to RSS Feed
- Mark Topic as New
- Mark Topic as Read
- Float this Topic for Current User
- Bookmark
- Subscribe
- Mute
- Printer Friendly Page
- Mark as New
- Bookmark
- Subscribe
- Mute
- Subscribe to RSS Feed
- Permalink
- Report Inappropriate Content
Issues in Pareto Chart
Dear All,
I am facing issues while developing Pareto chart in QlikView.
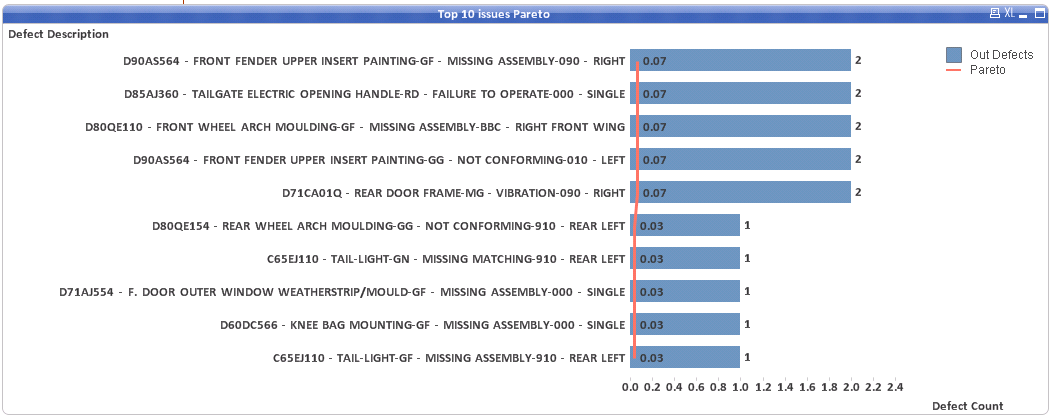
I have a bar chart that shows top 10 defects and their count. The sum of defect count is 15 (Screenshot 1 attached).
I have set the dimensional limits to largest 10 that's why displaying top 10 defects.
There are actually 30 defects that occurred for the respective selection.
I need to create a Pareto chart where I need to bring a line that should calculate sum of top 10 defects internally like below:
Sum of 1st 10 defects = 12
Value of line chart on 1st bar should be : (2/12)*100 = 16.66
Value of line chart on 2nd bar should be : ((2+2)/12)*100=33.33
Value of line chart on 3rd bar should be : (2+2+2)/12)*100=50
Value of line chart on 4th bar should be : (2+2+2+2)/12) *100=66.66
Value of line chart on 5th bar should be : (2+2+2+2+2)/12) *100= 83.33
Value of line chart on 6th bar should be : (2+2+2+2+2+1)/12) *100= 91.66
Value of line chart on 7th bar should be : (2+2+2+2+2+1+1)/12) *100= 100
Value of line chart on 8th bar should be : (2+2+2+2+2+1+1+1)/12) *100= 108.33
Value of line chart on 9th bar should be : (2+2+2+2+2+1+1+1+1)/12) *100= 116.66
Value of line chart on 10th bar should be : (2+2+2+2+2+1+1+1+1+1)/12) *100= 125
When I am trying to implement the same, it is calculating the sum of all the defects ( 30 is the sum of all defects) and using below formula
:
=(count( distinct if($(vCondition_DateRange) and DataProd=New_DATE and ADS_Turno=Turno
and Anomalia_DATE <> Date(floor([Dte_Risoluzione])) , Dte_Insert))
+
count( distinct if($(vCondition_DateRange) and DataProd=New_DATE and ADS_Turno=Turno
and Anomalia_DATE = Date(floor([Dte_Risoluzione])) and IdPtoRisoluzione<>IdPtoDelibera , Dte_Risoluzione)))
/
(count( total distinct if($(vCondition_DateRange) and DataProd=New_DATE and ADS_Turno=Turno
and Anomalia_DATE <> Date(floor([Dte_Risoluzione])) , Dte_Insert))
+
count( total distinct if($(vCondition_DateRange) and DataProd=New_DATE and ADS_Turno=Turno
and Anomalia_DATE = Date(floor([Dte_Risoluzione])) and IdPtoRisoluzione<>IdPtoDelibera , Dte_Risoluzione)))
where
=count( distinct if($(vCondition_DateRange) and DataProd=New_DATE and ADS_Turno=Turno
and Anomalia_DATE <> Date(floor([Dte_Risoluzione])) , Dte_Insert))
+
count( distinct if($(vCondition_DateRange) and DataProd=New_DATE and ADS_Turno=Turno
and Anomalia_DATE = Date(floor([Dte_Risoluzione])) and IdPtoRisoluzione<>IdPtoDelibera , Dte_Risoluzione))
is the formula for calculating defect count.
Can anyone help me to undergo this requirement , in which QV should calculate the sum of top 10 defects and not all defects and should display line chart as per the above requirement.
Anyone's help is greatly appreciated.
Thanks in advance.
Let me know if the requirement is unclear.
Regards,
Amber Jain.
- Mark as New
- Bookmark
- Subscribe
- Mute
- Subscribe to RSS Feed
- Permalink
- Report Inappropriate Content
I think you can try to use the accumulate function in the chart, or could you please give a small sample, so I can try to figure out to you.
Thanks
Aiolos Zhao
- Mark as New
- Bookmark
- Subscribe
- Mute
- Subscribe to RSS Feed
- Permalink
- Report Inappropriate Content
Hi Aiolos,
Thank you for your prompt response on this.
I cannot provide sample as it is a big data model in my application and I am posting a confusion for small part of the dashboard.
Defect_Description is the dimension that I have used and Defect Count is the expression I have used whose formula I have provided in first post.
can you explain about Accumulate function in detail?
In the meanwhile I am trying to give a sample for this.
Regards,
Amber Jain.