- Mark as New
- Bookmark
- Subscribe
- Mute
- Subscribe to RSS Feed
- Permalink
- Report Inappropriate Content
It is possble to split a stacked chart?
Hi all,
I am a beginer in Qlikview. Before using qlikview, I have experience using other data visualization tools.
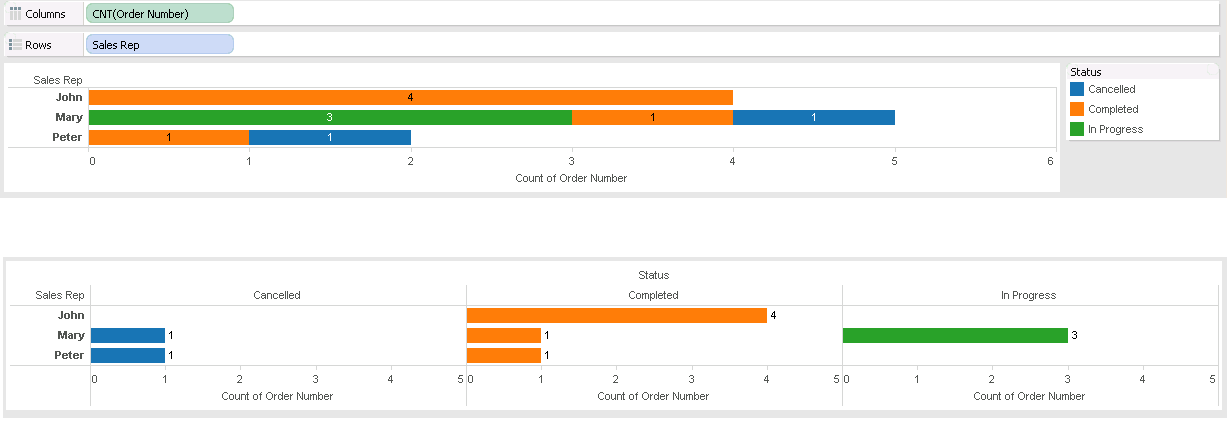
Given the following set of data, I know I can plot a stacked chart like the one shown below using qlikview. I am wondering if I can split the stacked bar chart to achieve the result shown in the second chart? I cannot figure out the way to do it so far, although this can be easily achieved using other tools. Thanks
SalesRep Order No. Status Transaction Amount
Mary T000001 Cancelled 100
Mary T000002 Completed 100
Mary T000003 In Progress 100
Mary T000004 In Progress 100
Mary T000005 In Progress 100
John T000006 Completed 175
John T000007 Completed 175
John T000008 Completed 175
John T000009 Completed 200
Peter T000010 Completed 200
Peter T000011 Cancelled 200

- Mark as New
- Bookmark
- Subscribe
- Mute
- Subscribe to RSS Feed
- Permalink
- Report Inappropriate Content
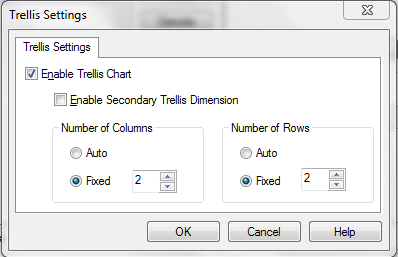
Charts --> Properties --> Dimension tab --> go to Trellis
You will find below screenshot.

Here you can set the view by choosing no. of columns and no. of rows.
- Mark as New
- Bookmark
- Subscribe
- Mute
- Subscribe to RSS Feed
- Permalink
- Report Inappropriate Content
Go for the trellis chart.