Unlock a world of possibilities! Login now and discover the exclusive benefits awaiting you.
- Qlik Community
- :
- All Forums
- :
- QlikView App Dev
- :
- Join, Link, Concat, ApplyMap, or all of the above?
- Subscribe to RSS Feed
- Mark Topic as New
- Mark Topic as Read
- Float this Topic for Current User
- Bookmark
- Subscribe
- Mute
- Printer Friendly Page
- Mark as New
- Bookmark
- Subscribe
- Mute
- Subscribe to RSS Feed
- Permalink
- Report Inappropriate Content
Join, Link, Concat, ApplyMap, or all of the above?
Hello All,
I've read articles and seen examples of joins, link tables, concatenates, applymaps and dimension tables, but I haven't found an example that matches my situation. From reading about each of these it seems I may need to do a combination of them in order to correctly link my data. I have many fact tables with either 2 or 3 key fields in them. These fact tables are very large (most have tens of millions of rows). Here is a simplified version of each table.
Table1: | Table2: | Table3: | Table4: | Table5: | Table6: | Table7:
Key1, | Key1, | Key1, | Key1, | Key2, | Key1, | Key1,
Key2, | Metric11, | Metric13,| Key3, | Key3, | Key3, | Key2,
Key3, | Metric12 | Metric14,| Metric16, | Metric16, | Metric19,| Key3,
Metric1,| Metric15 | | Metric17, | Metric17, | Metric20 | Metric21,
Metric2,| | | Metric18 | Metric18 | | Metric22,
Metric3,| | | | | | Metric23
Table1 details the parts that make up a product, so these Keys are not distinct. The other tables hold details about the parts (Key2) and products (Key1), sometimes depending on their location (Key3).
Each of these tables have many more fields (Metrics) in them but this is a simplified version to show where the keys are in each table.
I've considered a link table but I'm not sure how to create the key field when each table has a different number of keys in them.
Can anyone help me connect this table correctly as to keep metrics from duplicating/summing incorrectly and achieve optimal performance? (keep in mind, some of these tables have millions of rows in them) With this much data, synthetic keys will give me incorrect results.
I appreciate any help! Thank you!
I've attached a sample with some made up data using inline tables, however my data will be coming from QVDs. I've also tried to decrease the space between tables in the explanation in hopes that it formats correctly when published.
EDIT 1/29/16 - STILL LOOKING FOR HELP!
- « Previous Replies
-
- 1
- 2
- Next Replies »
- Mark as New
- Bookmark
- Subscribe
- Mute
- Subscribe to RSS Feed
- Permalink
- Report Inappropriate Content
Sorry for the slow reply. I appreciate you taking the time to help me solve this, however, I'm still running into an issue when looking at your example.
If I want to view the inventory of the parts that make up a selected product, how would I create that connection?
In your example, I created a bar chart with the dimension Part. The expression is Avg(Inv_Qty). When selecting a Product from a listbox, I want the bar chart to display the Part numbers that make up the selected Product and the Part's Inventory Qty (with respect to a selected Inv_Date if one is chosen).
Right now your example displays this:
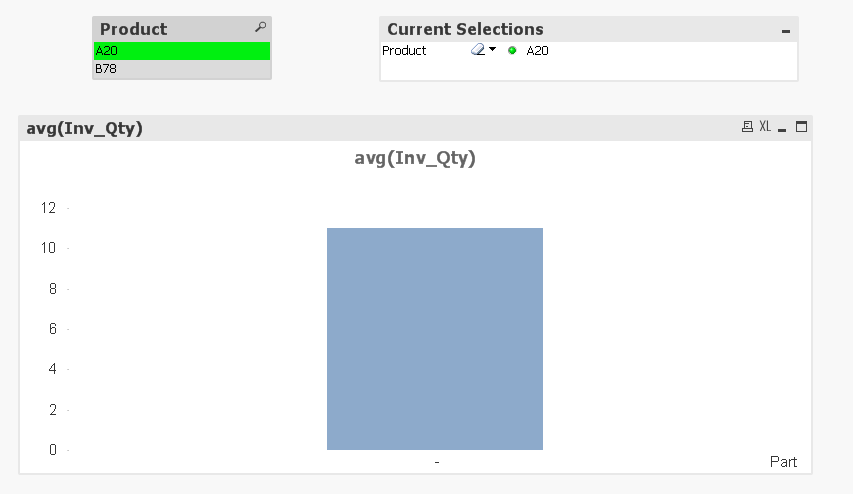
It does not list out the Parts that are in the selected Product. I think this may be due to how the Inventory and BOM tables were linked.
Thoughts?
- Mark as New
- Bookmark
- Subscribe
- Mute
- Subscribe to RSS Feed
- Permalink
- Report Inappropriate Content
STILL LOOKING FOR HELP!
Does anyone have any more input? I really need help connecting my data model.
To make it simpler I've made an Excel doc with a new example set of data. I need to connect the following sheets within the attached Excel file.
I need to be able to select a Product and in one table, see the corresponding Parts that make up the selected Products while in another chart, I want to see the inventory quantities for the Parts that are in the selected Products. Concatenating the inventory and BOM tabs does not work because then the Part inventory is not linked when a Product is selected.
This is very important and in need asap! Thank you all for your help!
- « Previous Replies
-
- 1
- 2
- Next Replies »