Unlock a world of possibilities! Login now and discover the exclusive benefits awaiting you.
- Qlik Community
- :
- All Forums
- :
- QlikView App Dev
- :
- Re: KPI sum problem
- Subscribe to RSS Feed
- Mark Topic as New
- Mark Topic as Read
- Float this Topic for Current User
- Bookmark
- Subscribe
- Mute
- Printer Friendly Page
- Mark as New
- Bookmark
- Subscribe
- Mute
- Subscribe to RSS Feed
- Permalink
- Report Inappropriate Content
KPI sum problem
Hello all,
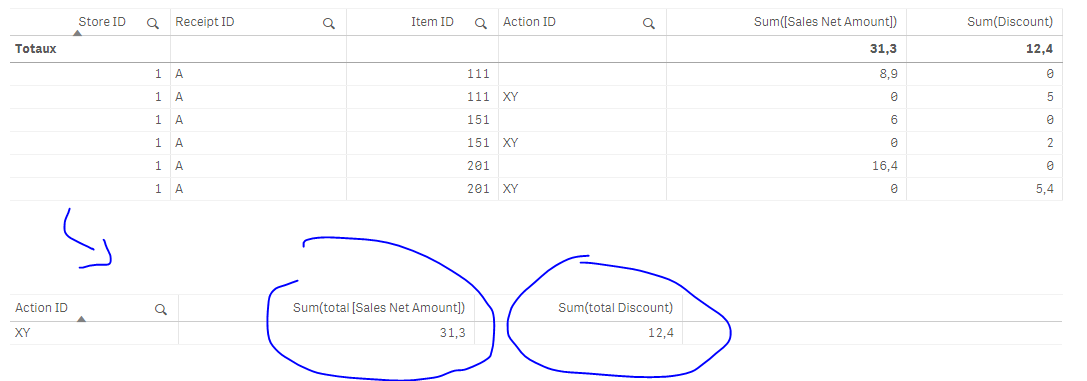
I have a chart displaying marketing action performance based on two KPI : total of sales and total of discounts.
The Fact table has the following fields:
| Store ID | Receipt ID | Item ID | Sales Gross Amount | Sales Net Amount | Discount | Action ID |
|---|---|---|---|---|---|---|
| 1 | A | 111 | 13.90 | 8.90 | - | - |
| 1 | A | 201 | 10.90 | 8.20 | - | - |
| 1 | A | 201 | 10.90 | 8.20 | - | - |
| 1 | A | 151 | 8.00 | 6.00 | - | - |
| 1 | A | 111 | - | - | 5.00 | XY |
| 1 | A | 201 | - | - | 2.70 | XY |
| 1 | A | 201 | - | - | 2.70 | XY |
| 1 | A | 151 | - | - | 2.00 | XY |
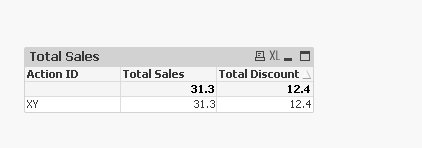
The resulting chart has to be like this:
| Action ID | Total Sales | Total Discount |
|---|---|---|
| XY | 31.30 | 12.40 |
The problem is with the Total Sales Net Amount, defined as follows:
=Sum(Aggr(Sum(TOTAL <[Receipt ID]> [Sales Net Amount]),[Action Id], [Receipt ID]))
it takes into account distinct items. So in the example above the result is : 23.10 which is not correct. The good value should be 31.30.
Any idea how to write the expression?
Ce message a été modifié par : Elina Demerdjieva
- « Previous Replies
-
- 1
- 2
- Next Replies »
- Mark as New
- Bookmark
- Subscribe
- Mute
- Subscribe to RSS Feed
- Permalink
- Report Inappropriate Content
Hi,
try with this:
=sum(aggr(sum([Sales Net Amount]),[Marketing Action ID],[Receipt ID]))
or with this:
=sum(total <[Receipt ID],[Marketing Action ID]> [Sales Net Amount])
- Mark as New
- Bookmark
- Subscribe
- Mute
- Subscribe to RSS Feed
- Permalink
- Report Inappropriate Content
Hi Youssef,
None of these work. I added some details in the description to help the understanding of the underlying structure.
Any idea ?
- Mark as New
- Bookmark
- Subscribe
- Mute
- Subscribe to RSS Feed
- Permalink
- Report Inappropriate Content
Try putting NODISTINCT in aggr() like:
=Sum(Aggr(NODISTINCT Sum(TOTAL <[Receipt ID]> [Sales Net Amount]),[Action Id], [Receipt ID]))
- Mark as New
- Bookmark
- Subscribe
- Mute
- Subscribe to RSS Feed
- Permalink
- Report Inappropriate Content
Did you change the values of the table above ?
- Mark as New
- Bookmark
- Subscribe
- Mute
- Subscribe to RSS Feed
- Permalink
- Report Inappropriate Content
Hi,
Based on the data you provided, I would probably try to separate the discounts into a new table and link them to sales by store id, receipt id and item id (use autonumber or any other method to create composite key). This way each action id should link properly to the sales rows.
Then you should be able to get rid the aggr-expression and just use a normal sum. Seems much easier.
-Teemu
- Mark as New
- Bookmark
- Subscribe
- Mute
- Subscribe to RSS Feed
- Permalink
- Report Inappropriate Content
Hi Teemu,
I cannot change the data model, unfortunately. I tried the NODISTINCT qualifier but there is no effect on the Total Sales.
- Mark as New
- Bookmark
- Subscribe
- Mute
- Subscribe to RSS Feed
- Permalink
- Report Inappropriate Content
Am I missing sthing?
- Mark as New
- Bookmark
- Subscribe
- Mute
- Subscribe to RSS Feed
- Permalink
- Report Inappropriate Content
Create a chart With
Calculated Diemsion as =PIck(WildMatch([Action ID],'XY','*-*'),'XY','XY')
Expression 1. Sum([Sales Net Amount])
2. Sum(Discount)
- Mark as New
- Bookmark
- Subscribe
- Mute
- Subscribe to RSS Feed
- Permalink
- Report Inappropriate Content
Hi,
What if there are multiple different actions? I'm assuming it's possible.
-Teemu
- « Previous Replies
-
- 1
- 2
- Next Replies »