Unlock a world of possibilities! Login now and discover the exclusive benefits awaiting you.
- Qlik Community
- :
- All Forums
- :
- QlikView App Dev
- :
- Re: Re: Keeping all dimension intact during filter...
- Subscribe to RSS Feed
- Mark Topic as New
- Mark Topic as Read
- Float this Topic for Current User
- Bookmark
- Subscribe
- Mute
- Printer Friendly Page
- Mark as New
- Bookmark
- Subscribe
- Mute
- Subscribe to RSS Feed
- Permalink
- Report Inappropriate Content
Keeping all dimension intact during filters
Hi,
There is a requirement where you need to keep all the dimension values in the chart in display even if there is a filter of that dimension applied on the report. The dimension that do not belong to the filter applied currently will show their counts as 0:
Example:
Consider a report showing number of countries in each continent in a bar charts:
Asia: 102
Africa: 57
Europe: 34
America: 23
Now if a normal filter is applied then chart will only show value of Africa:
Africa: 57
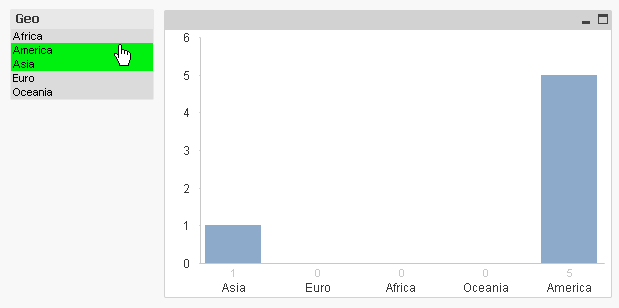
However I want that when user applies a filter of Africa, the chart should look like this:
Asia: 0
Africa: 57
Europe: 0
America: 0
Anyway we can achieve this in qlikview?
- Tags:
- filters
Accepted Solutions
- Mark as New
- Bookmark
- Subscribe
- Mute
- Subscribe to RSS Feed
- Permalink
- Report Inappropriate Content
Try checking Show all values on the dimension tab and turning off suppress zero values and hide missing values on the presentation tab.
I think that combo may work
If you want 0 instead of '-' you can change what it displays on the presentation tab as well.
- Mark as New
- Bookmark
- Subscribe
- Mute
- Subscribe to RSS Feed
- Permalink
- Report Inappropriate Content
uncheck
suppress 0 values
in presentation tab
- Mark as New
- Bookmark
- Subscribe
- Mute
- Subscribe to RSS Feed
- Permalink
- Report Inappropriate Content
This doesnt serve my purpose.
When a filter is applied on africa, only africa is shown in the report, rest all dimension values disappear.
What I want is to have the other dimension values which do not satisfy the filter condition, shown with count as 0
- Mark as New
- Bookmark
- Subscribe
- Mute
- Subscribe to RSS Feed
- Permalink
- Report Inappropriate Content
Try checking Show all values on the dimension tab and turning off suppress zero values and hide missing values on the presentation tab.
I think that combo may work
If you want 0 instead of '-' you can change what it displays on the presentation tab as well.
- Mark as New
- Bookmark
- Subscribe
- Mute
- Subscribe to RSS Feed
- Permalink
- Report Inappropriate Content
This is helpful for a bar chart.
Can you also suggest something for a straight table? I tried the combinations but it didn't work
- Mark as New
- Bookmark
- Subscribe
- Mute
- Subscribe to RSS Feed
- Permalink
- Report Inappropriate Content
- Mark as New
- Bookmark
- Subscribe
- Mute
- Subscribe to RSS Feed
- Permalink
- Report Inappropriate Content
it should be the same as the bar chart
see attachment