Unlock a world of possibilities! Login now and discover the exclusive benefits awaiting you.
- Qlik Community
- :
- All Forums
- :
- QlikView App Dev
- :
- Label issue
- Subscribe to RSS Feed
- Mark Topic as New
- Mark Topic as Read
- Float this Topic for Current User
- Bookmark
- Subscribe
- Mute
- Printer Friendly Page
- Mark as New
- Bookmark
- Subscribe
- Mute
- Subscribe to RSS Feed
- Permalink
- Report Inappropriate Content
Label issue
Dear Sir/Madam
I have faced two problems stated below, please help :
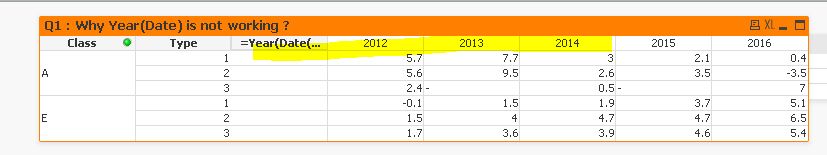
1. Can not get Year from Date?
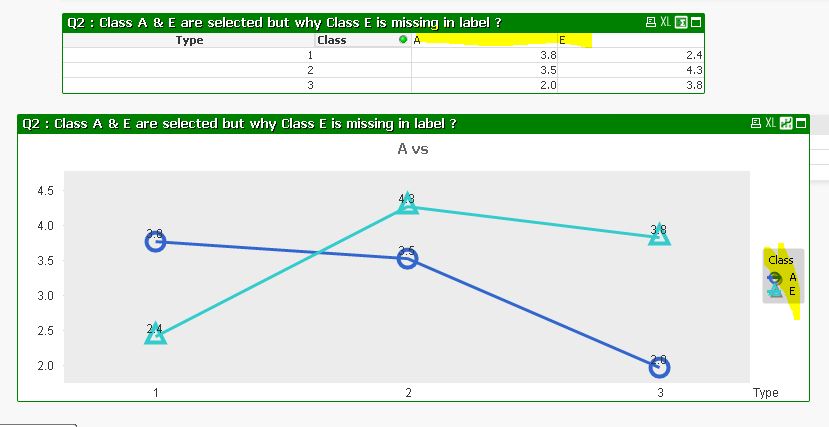
2. Label E cannot be shown after selecting both A & E Class?
Thank you
Tracy
Accepted Solutions
- Mark as New
- Bookmark
- Subscribe
- Mute
- Subscribe to RSS Feed
- Permalink
- Report Inappropriate Content
1) Can not get Year from Date?
use like below
=Year(Date(Num#(Date),'DD-MM-YYYY'))
also note if your going to use this year field in many chart object then use this code in back end one time and can reuse multiple chart.
2) Label E cannot be shown after selecting both A & E Class?
refer to the attachment.
just add Class Dimension and create a measure as avg(Data) then u can get the desired output. thanks
- Mark as New
- Bookmark
- Subscribe
- Mute
- Subscribe to RSS Feed
- Permalink
- Report Inappropriate Content
Dear Devarasu R
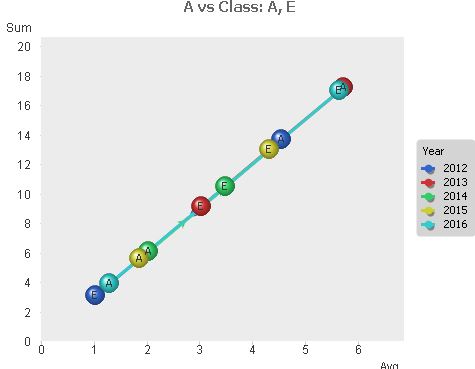
Thank you for your help, can you advise how to present both A & E in Scatter Chart for just a year ?.
Thank you
Tracy
- Mark as New
- Bookmark
- Subscribe
- Mute
- Subscribe to RSS Feed
- Permalink
- Report Inappropriate Content
Hi,
yes. you need to have min 2 measures for the scatter chart.
let say u can have sum(Data) and avg(Data)
- Mark as New
- Bookmark
- Subscribe
- Mute
- Subscribe to RSS Feed
- Permalink
- Report Inappropriate Content
Dear Devarasu R
Many thanks for your kindness to share an article on scatter chart and detailed illustration, well done.
I would like to go one step further, please advise how to present average data for Type on Y-axis and Class on X-axis in particular year using Scatter Chart ?
Cheer
Tracy
- Mark as New
- Bookmark
- Subscribe
- Mute
- Subscribe to RSS Feed
- Permalink
- Report Inappropriate Content
Dear Devarasu R
Attached is a sample extracted from www.360globalconsulting.com which is similar to what I requested in previous reply to you.

Thank you
Tracy