Unlock a world of possibilities! Login now and discover the exclusive benefits awaiting you.
- Qlik Community
- :
- All Forums
- :
- QlikView App Dev
- :
- Last Fiscal Year Month (QlikView)
- Subscribe to RSS Feed
- Mark Topic as New
- Mark Topic as Read
- Float this Topic for Current User
- Bookmark
- Subscribe
- Mute
- Printer Friendly Page
- Mark as New
- Bookmark
- Subscribe
- Mute
- Subscribe to RSS Feed
- Permalink
- Report Inappropriate Content
Last Fiscal Year Month (QlikView)
Hi
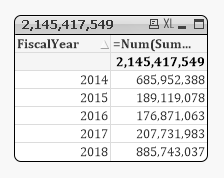
I have a requirement to display the chart for Revenue of Last Fiscal Year Month every year
Data i have is till 2018-06
I need to display chart for 2017-09, 2016-09, 2015-09... (09 is Septemeber which is the max fiscal month in every completed year. In 2018, we have data only till 2018-06 where 06 is March)
If i perform Max(FiscalYearMonth) i get 2018-06 and 2017-06...
I need to display the chart for Last Fiscal Year Month excluding 2018 in that way the chart should display 2017-09,2016-09....
Can someone please help on the same.
Currently I'm using below expression which gives only for 2017-09
=Num(Sum({<Date={'<=$(=YearEnd(Today(),-1,10))'},Fiscal_YearMonth={'$(=max({<FiscalYear = {"$(vMaxLastYear)"}>}Fiscal_YearMonth))'}>}Revenue),'#,##0')
- « Previous Replies
-
- 1
- 2
- Next Replies »
- Mark as New
- Bookmark
- Subscribe
- Mute
- Subscribe to RSS Feed
- Permalink
- Report Inappropriate Content
Would you be able to share a sample to check this?
- Mark as New
- Bookmark
- Subscribe
- Mute
- Subscribe to RSS Feed
- Permalink
- Report Inappropriate Content
Attached sunny.
Also i scrambled the data.
You can refer Sheet 3 for what we are trying.
And out of this question, i asked Fractile. You can see the Dashboard tab which has the scatter plots and we need to show some better distribution like what we are talking in different thread.
- Mark as New
- Bookmark
- Subscribe
- Mute
- Subscribe to RSS Feed
- Permalink
- Report Inappropriate Content
Try this
=Num(Sum({<Date, Fiscal_YearMonth = {"=SetDateYear(Fiscal_YearMonth, Year(Today())) =SetDateYear(Max(TOTAL {<FiscalYear = {[$(vMaxLastYear)]}>} Fiscal_YearMonth), Year(Today())) or Fiscal_YearMonth = Max(TOTAL {<Investment = {
- Mark as New
- Bookmark
- Subscribe
- Mute
- Subscribe to RSS Feed
- Permalink
- Report Inappropriate Content
Thanks Sunny
- « Previous Replies
-
- 1
- 2
- Next Replies »