Unlock a world of possibilities! Login now and discover the exclusive benefits awaiting you.
- Qlik Community
- :
- All Forums
- :
- QlikView App Dev
- :
- Legend for expression on Bubble Chart/Grid Chart
Options
- Subscribe to RSS Feed
- Mark Topic as New
- Mark Topic as Read
- Float this Topic for Current User
- Bookmark
- Subscribe
- Mute
- Printer Friendly Page
Turn on suggestions
Auto-suggest helps you quickly narrow down your search results by suggesting possible matches as you type.
Showing results for
Not applicable
2012-04-30
11:35 AM
- Mark as New
- Bookmark
- Subscribe
- Mute
- Subscribe to RSS Feed
- Permalink
- Report Inappropriate Content
Legend for expression on Bubble Chart/Grid Chart
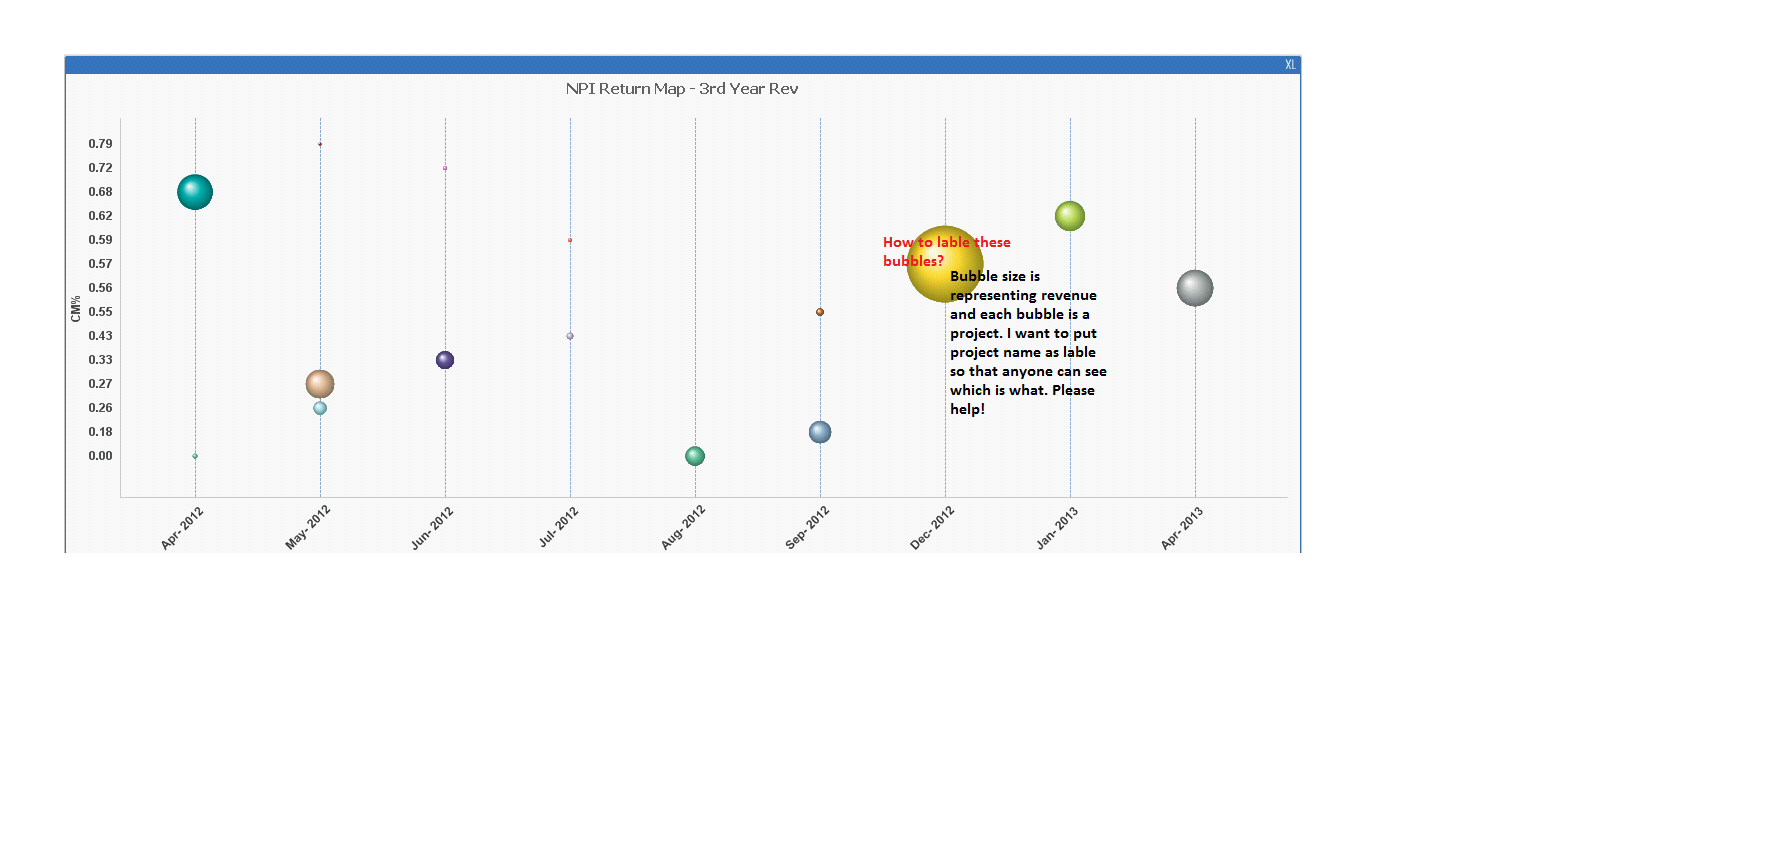
I am having hard time figuring out way to lable the bubbles of Grid Chart. Attached pic will make it more clear. I have a grid chart with two dimentions (margin and date) and one expression revenue. Bubble size represents the revenue size but i am not able to find out way to lable these bubbles as project name. Any ideas? I will appreciate every help. Thank you!
1,206 Views
2 Replies
Not applicable
2012-04-30
12:32 PM
Author
- Mark as New
- Bookmark
- Subscribe
- Mute
- Subscribe to RSS Feed
- Permalink
- Report Inappropriate Content
try something like this:
dual(Capitalize([Project Name]) & ' : ' & num(Sum(Revenue), '$#,##0.00'), Sum(Revenue))
531 Views
Not applicable
2012-04-30
01:40 PM
Author
- Mark as New
- Bookmark
- Subscribe
- Mute
- Subscribe to RSS Feed
- Permalink
- Report Inappropriate Content
Thanks for reply but unfortunately it did not work. same chart showing up with no legends. Can you create an example and attach, I would really appreciate it.
531 Views