Unlock a world of possibilities! Login now and discover the exclusive benefits awaiting you.
- Qlik Community
- :
- All Forums
- :
- QlikView App Dev
- :
- Legends in charts
- Subscribe to RSS Feed
- Mark Topic as New
- Mark Topic as Read
- Float this Topic for Current User
- Bookmark
- Subscribe
- Mute
- Printer Friendly Page
- Mark as New
- Bookmark
- Subscribe
- Mute
- Subscribe to RSS Feed
- Permalink
- Report Inappropriate Content
Legends in charts
Hi,
I want to show the legends in the charts in a horizontally, not vertically (stacked).
- Tags:
- new_to_qlikview
- « Previous Replies
-
- 1
- 2
- Next Replies »
- Mark as New
- Bookmark
- Subscribe
- Mute
- Subscribe to RSS Feed
- Permalink
- Report Inappropriate Content
PFA...
I want them to look like the below:
- Mark as New
- Bookmark
- Subscribe
- Mute
- Subscribe to RSS Feed
- Permalink
- Report Inappropriate Content
Hi,
I think you need to adjust your chart area and legend area with the red rectangular lines.
Thanks & Best Reagrds,
Anand
HTH
- Mark as New
- Bookmark
- Subscribe
- Mute
- Subscribe to RSS Feed
- Permalink
- Report Inappropriate Content
Yes, we can do but for that we need to select "Reset user Sizing" and "Reset User Docking" in General tab.
Thanks
Vinay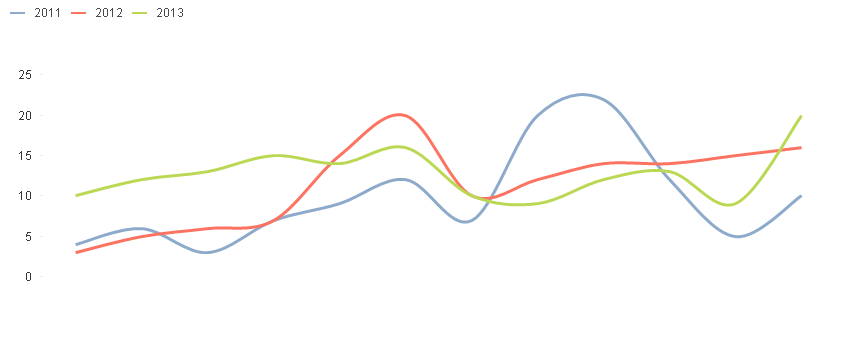
- Mark as New
- Bookmark
- Subscribe
- Mute
- Subscribe to RSS Feed
- Permalink
- Report Inappropriate Content
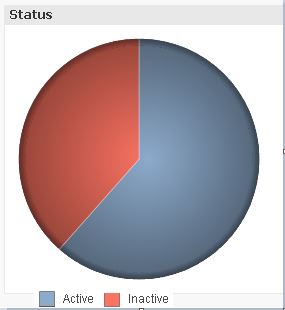
This is peculiar. It seems to work only when the legend is made up of expressions (for the pie chart, the legend represents the dimension).
As an alternative since I am assuming your dimensions are limited to only a couple, put the values on the pie chart itself by using Values on Data Points with another expression of Status. This way Active/Inactive show next to the appropriate "slice". I also showed as an example, a bar chart where the legend consists of just expressions. In this case, the way to make the legend horizontally works as described by the others here.
If you are insistent on the horizontal legend, take a screen shot of a horizontal legend and then use this as a textbox below your chart.
Please find attached.
Hope this helps!
- « Previous Replies
-
- 1
- 2
- Next Replies »