Unlock a world of possibilities! Login now and discover the exclusive benefits awaiting you.
- Qlik Community
- :
- All Forums
- :
- QlikView App Dev
- :
- Re: Legends values in the segments
- Subscribe to RSS Feed
- Mark Topic as New
- Mark Topic as Read
- Float this Topic for Current User
- Bookmark
- Subscribe
- Mute
- Printer Friendly Page
- Mark as New
- Bookmark
- Subscribe
- Mute
- Subscribe to RSS Feed
- Permalink
- Report Inappropriate Content
Legends values in the segments
Hi All.
Is there any way to show the legend values inside the segment as per color?
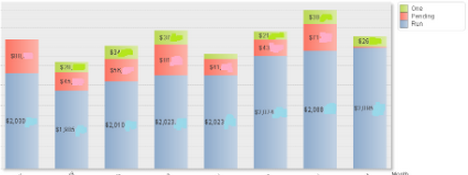
For the above chart, i would like to show the legend values in the segments of bar as per respective color.
Will this be possible?
- Tags:
- new_to_qlikview
- Mark as New
- Bookmark
- Subscribe
- Mute
- Subscribe to RSS Feed
- Permalink
- Report Inappropriate Content
Hi
I don't think this is possible without clunky solutions like laying text objects over the chart (which will not re-align with the chart when selections are made or the source data change).
HTH
Jonathan
- Mark as New
- Bookmark
- Subscribe
- Mute
- Subscribe to RSS Feed
- Permalink
- Report Inappropriate Content
Yep - really clunky to get what you need: you can at least get one expression to display by checking the Data Point Value in the properties.
Not ideal unfortunately.
- Mark as New
- Bookmark
- Subscribe
- Mute
- Subscribe to RSS Feed
- Permalink
- Report Inappropriate Content
Hi, there is a possibility, but not static
Expand the + symbol in the expression lablel --> select text color --> give the color which you want like RGB(255,150,100) etc.